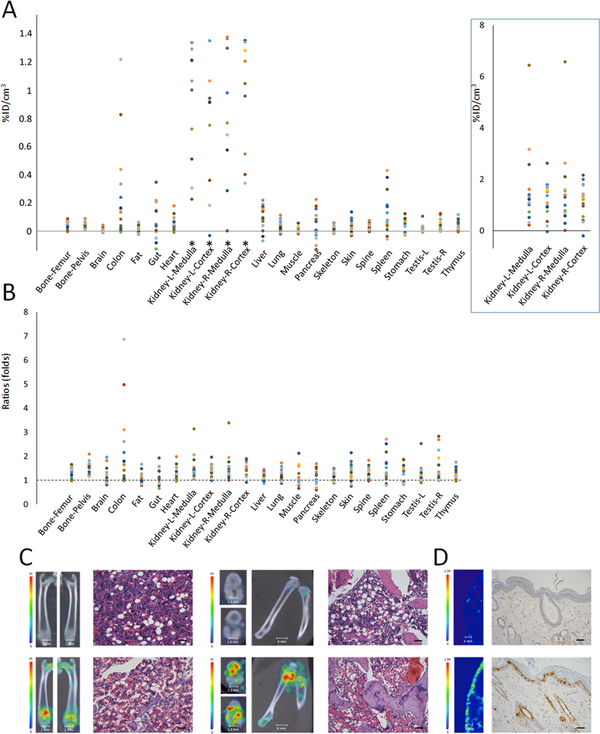
Figure 2.
In vivo single time point study of methotrexate treated rats (100 mg/kg, n = 15) at 24 hours. A) Scatter plot of net change in radioactivity uptake in terms of percentage of injected dose per cm3 in methotrexate treated (n = 15) over the mean of nontreated control tissues (n = 15). *Signal changes in the kidney are plotted at a different scale in the box on right. B) Scatter plot of fold changes in radioactivity uptake among tissues. A ratio of 1 indicates no change. C) SPECT/CT fusion images of the femurs and knees in control and methotrexate treated animals are presented. Significant signal elevation was detected in the symphysis of the bones and knee joints. H&E stained section of femoral bone demonstrates a depletion of hematopoietic cells in bone marrow of methotrexate-treated animals (scale bar = 75 μm). D) SPECT images of skin obtained from the control and methotrexate treated animals with corresponding TUNEL images as indicated (apoptotic nuclei were stained positive with the deposition of brown pigment, scale bar = 75 μm).

