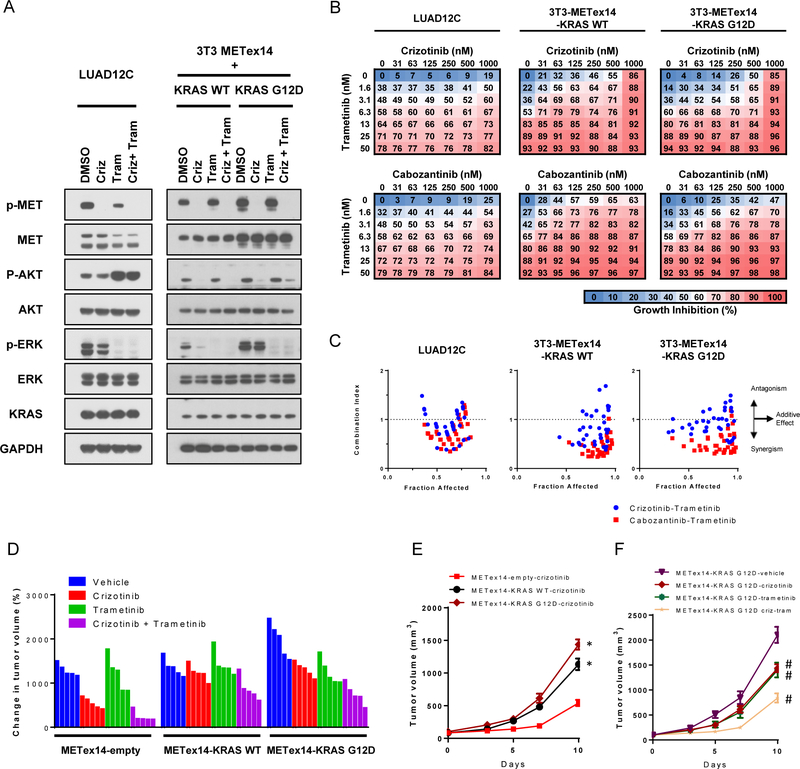
Figure 3: Trametinib synergizes with MET inhibitors in concurrent METex14 alteration and KRAS mutant cells.
A. LUAD12C, 3T3-METex14-KRAS WT, and -KRAS G12D cells were treated with crizotinib (1 μM), trametinib (25 nM), or a combination of trametinib (25 nM) and crizotinib (1μM) for 4 hours. Lysates were then subjected to immunoblotting. B. LUAD12C, 3T3-METex14-KRAS WT, and -KRAS G12D cells were treated with a combination of trametinib and either crizotinib or cabozantinib for 96 hours. Cell viability was determined by AlamarBlue. Data represented the mean value of growth inhibition ratio at each concentration of the drugs in four independent experiments. C. Dot plot indicates the combination index and fraction affected (inhibition ratio) of various drug concentration. D. 3T3-METex14-empty, -KRAS WT, and -KRAS G12D cells were implanted into a subcutaneous flank of athymic nude mice. When tumors reached approximately 100 mm3, mice were treated with vehicle or 25 mg/kg crizotinib, 1 mg/kg trametinib, or a combination of 25 mg/kg crizotinib and 1 mg/kg trametinib daily for 10 days. The relative change in volume from baseline of Individual tumors are shown in the waterfall plots. E. Tumors volume in animals with crizotinib treatment group are shown stratified by cell lines. *p<0.05, compared to the respective empty group. F. Tumors volume of 3T3-METex14-KRAS G12D xenografts are shown stratified by treatment group. #p<0.05, compared to vehicle-treated group.

