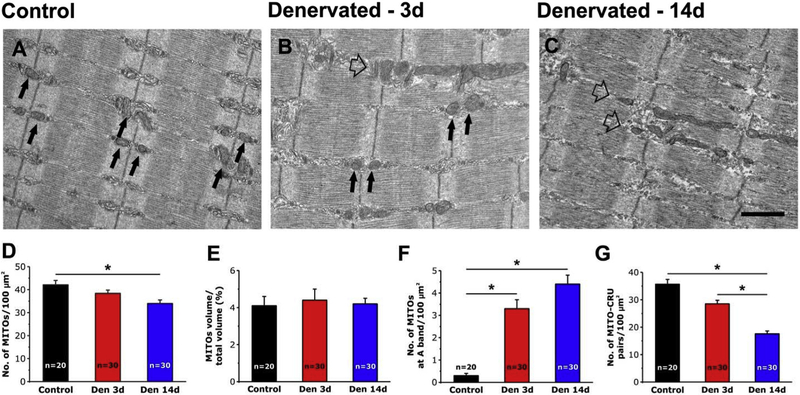
Fig. 4.
EM analysis of EDL fibers from control and denervated mice. A-C) Representative EM images showing EDL fibers from control mice (A), and from mice after 3 (B) and 14 (C) days of denervation. Black arrows point to mitochondria placed in the correct I band position, while empty arrows point to mitochondria forming longitudinal columns between myofibrils. D-G) Quantitative analysis of mitochondrial n./area, volume, disposition, and association with CRUs. Data are shown as mean ± SEM; n = number of EDL fibers analyzed; *p < 0.01 as evaluated by one-way ANOVA followed by post-hoc Tuckey test. Scale bars: A-C, 1 μm.

