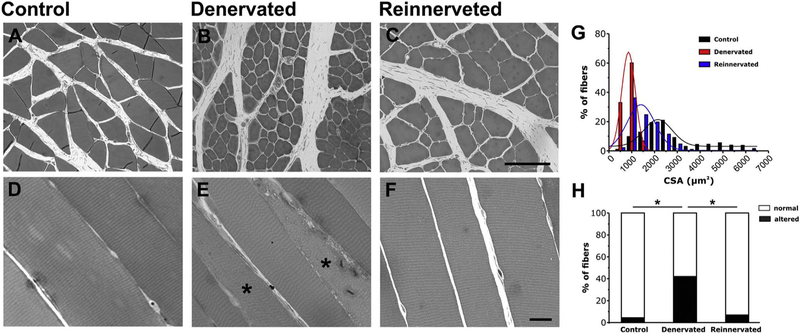
Fig. 6.
Histological analysis of EDL fibers from control, denervated and reinnervated rats. A-F) Representative histological images of transversal (A–C) and longitudinal (D–F) sections of EDL muscle fibers from control (A and B), denervated (C and D) and reinnervated (E and F) rats. Asterisk in E indicates fibers with internal areas with disarray of striation. G) Distribution frequency of CSA of EDL fibers. H) Percentage of fibers classified as normal (white) or altered (black). n = number of EDL fibers analyzed; *p < 0.01 as evaluated by one-way ANOVA followed by post-hoc Tuckey test. Scale bars: A-C, 100 μm; D-F, 20 μm.

