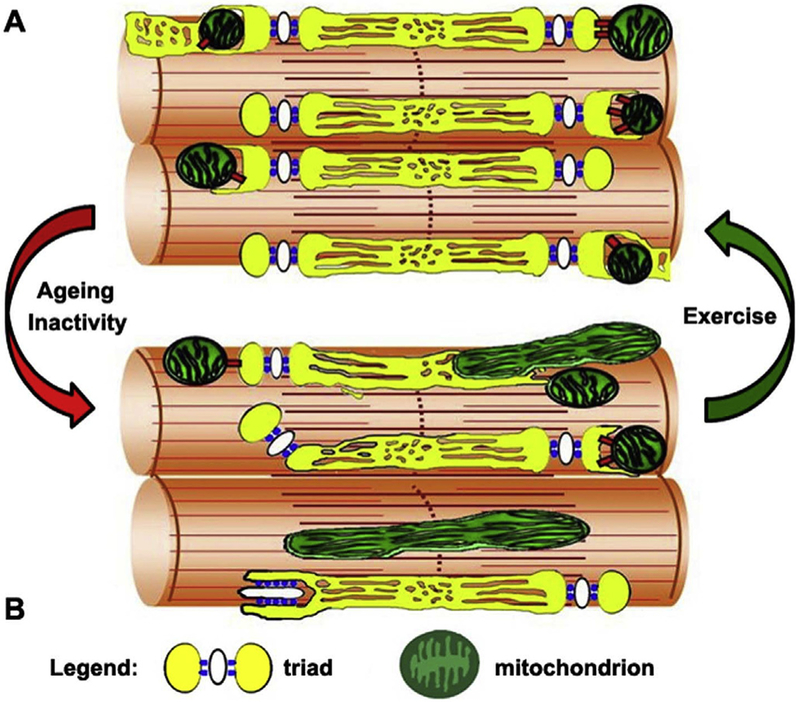
Fig. 8.
Graphical model summarizing the alterations caused by age and/or inactivity (red arrow) to CRUs and mitochondria morphology and distribution, changes that are reverted/prevented by exercise (green arrow). A) Modelling of normal morphology and distribution of mitochondria and CRUs in adult or exercised muscle. B) Modelling of altered distribution and morphology of mitochondria and CRUs caused by ageing and/inactivity. (For interpretation of the references to colour in this figure legend, the reader is referred to the Web version of this article.)

