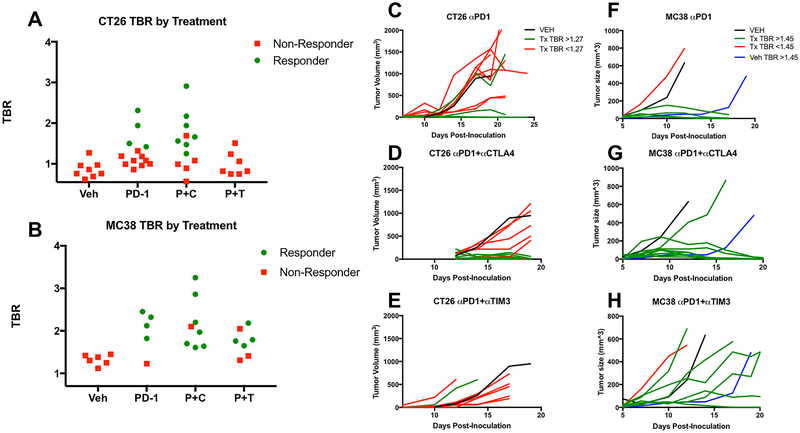
Figure 4-.
Individual tumor to blood (TBR) ratios for mice treated with vehicle (Veh, n=8 CT26, n=7 MC38) anti-PD-1 (PD-1 n=12 CT26, n=5 MC38), anti-PD-1 plus anti-CTLA-4 (P+C, n=12 CT26, n=7 MC38) or anti-PD-1 plus anti-TIM-3 (P+T n=7 CT26, n=7 MC38) therapies for A) CT26 and B) MC38 tumor bearing mice. Green circles denote mice with responses and pink boxes represent non-responsive tumors. Individual tumor growth curves for CT26 (C-E) and MC38 (F-H) tumors treated with the same therapy combinations are shown, with green lines corresponding to high GZP PET TBRs and pink lines to low GZP PET TBRs. The black lines are a representative mean of 8 vehicle mice and blue lines are representative of a single mouse with high GZP PET TBR that exhibited a partial response.

