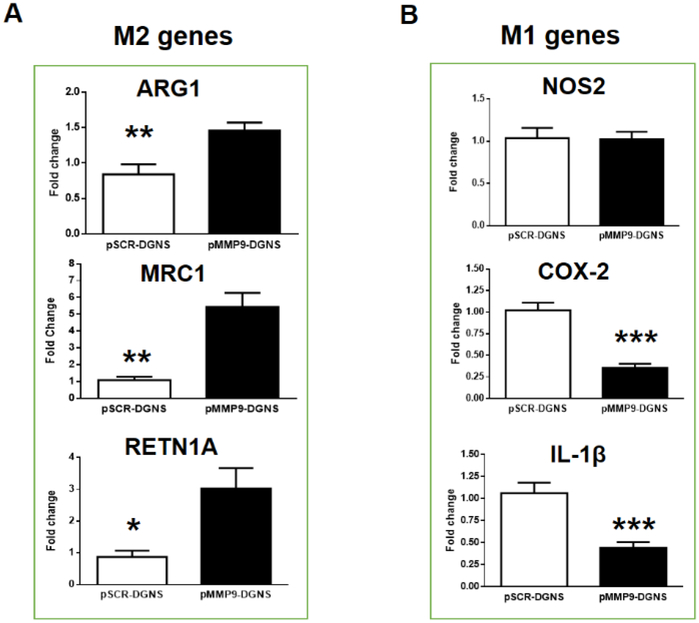
Figure 4. Hepatic immunomodulation of macrophages gene expression profiles in cirrhotic mice treated with pMMP9-DGNS.
(A) Quantification of gene expression profiles of M2 macrophages (Arg1, MRC1 and Retn1a) in cirrhotic livers from mice treated with scramble plasmid linked to dendrimer graphene nanostars (pSCR-DGNS) or MMP-9 plasmid linked to dendrimer graphene nanostars (pMMP9-DGNS) by Real-time PCR. (B) Quantification of gene expression profiles of M1 macrophages (iNOS, COX-2 and IL1-β) in cirrhotic livers from mice treated with pSCR-DGNS or pMMP9-DGNS by Real-time PCR. *** indicates P ≤ 0.0001, ** indicates P ≤ 0.01, * indicates P ≤ 0.05 using a Student’s t-test. Values are mean ± S.E.M.

