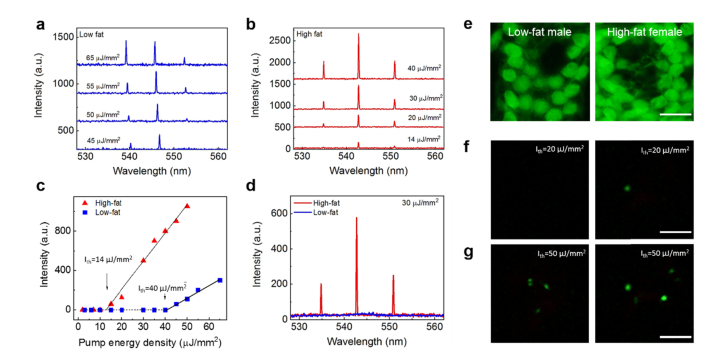
Fig. 4.
Comparison of laser emissions between low- and high-fat induced colon tissues. a, Example of lasing spectra of a normal colon tissue from a 15-month old low-fat male mouse stained with YOPRO under various pump energy densities. b, Example of lasing spectra of a normal colon tissue from a 15-month old female high-fat mouse stained with YOPRO under various pump energy densities. c, Spectrally integrated laser output as a function of pump energy density extracted from the laser spectra in a and b. The solid lines are the linear fit above the lasing threshold, which was 14 μJ/mm2 and 40 μJ/mm2 for the high-fat mouse and low-fat mouse, respectively. Tissue thickness = 10 μm. Cavity length = 15 μm. Excitation wavelength = 473 nm. d, Direct comparison of laser emission spectra of the same low-fat male (blue curve) and high-fat female (red curve) colon tissues used in c at fixed pump energy density of 30 µJ/mm2. e, Representative fluorescence microscopic images of colon cells from the same low-fat male (left column) and high-fat female (right column) colon tissues used in d. f, Representative laser emission images of colon cells from the same low-fat male (left column) and high-fat female (right column) mice used in e when pumped at 30 µJ/mm2. g, Laser emission images of the same sets of cells in f when the pump energy density increased to 70 µJ/mm2. All scale bars, 20 μm.

