Fig. 5.
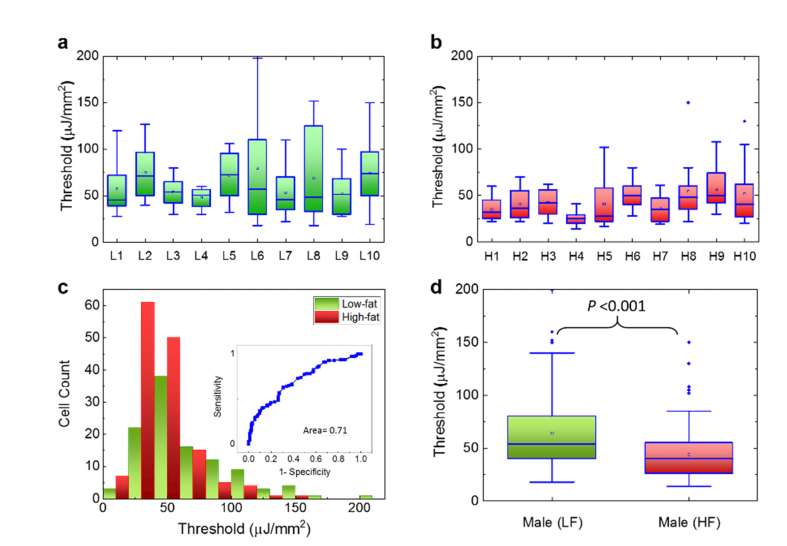
Assessment of the lasing threshold of low-fat and high-fat induced male mice. a, Statistics of the lasing threshold for cells in individual low-fat male colon tissues (10 mice) stained with YOPRO. b, Statistics of the lasing threshold for cells in individual high-fat male colon tissues (10 mice) stained with YOPRO. c, Histogram of all low-fat/high-fat cell lasing thresholds (N = 230) extracted from a and b. The inset is the corresponding Receiver Operating Characteristics (ROC) curve. The ROC curve is plotted by using the different excitations (in units of µJ/mm2) as the cut-off criterion. The area under the fitted curve is 0.71 and the sensitivity of 50% is obtained based on the cut-off criterion of 40 µJ/mm2. d, Statistic comparison of the lasing threshold for all 230 cells extracted from a and b. The p-value between the two groups is <10−3. The median is 54 and 40 µJ/mm2 for LF and HF, respectively. All tissues were 10 μm in thickness and were sandwiched in a 15 μm long cavity. [YOPRO] = 0.1 mM for all 20 mouse samples.

