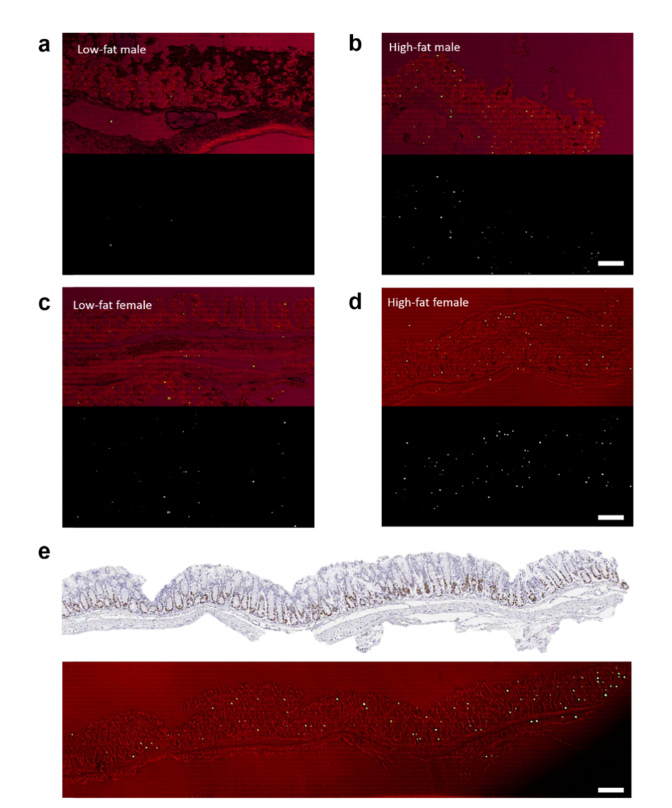
Fig. 10.
Laser-emission imaging of mice colon tissues. a, Representative low-fat male laser emission image (bottom) that is overlaid with the corresponding brightfield image (top). b, Representative high-fat male laser emission image (bottom) that is overlaid with the corresponding brightfield image (top). c, Representative low-fat female laser emission image (bottom) that is overlaid with the corresponding brightfield image (top). d, Representative high-fat laser emission image (bottom) that is overlaid with the corresponding brightfield image (top). e, IHC microscopic image of a high-fat female colon tissue labeled with Ki-67 biomarker (top image). The corresponding laser emission image (large scale scanning) overlaid with the corresponding brightfield image is shown in the bottom image. The tissues for the top image and the bottom image were sliced from the same FFPE block. The total area is 3 mm x 0.5 mm. All images were scanned and measured under a pump energy density of 45 µJ/mm2. All scale bars, 100 µm. The estimated number of lasing cells for images in a,b,c,d, and e are 4, 45, 16, 64, and 125, respectively. Note that the brightfield images appear to be red since they were taken through the mirror that blocks the green light.

