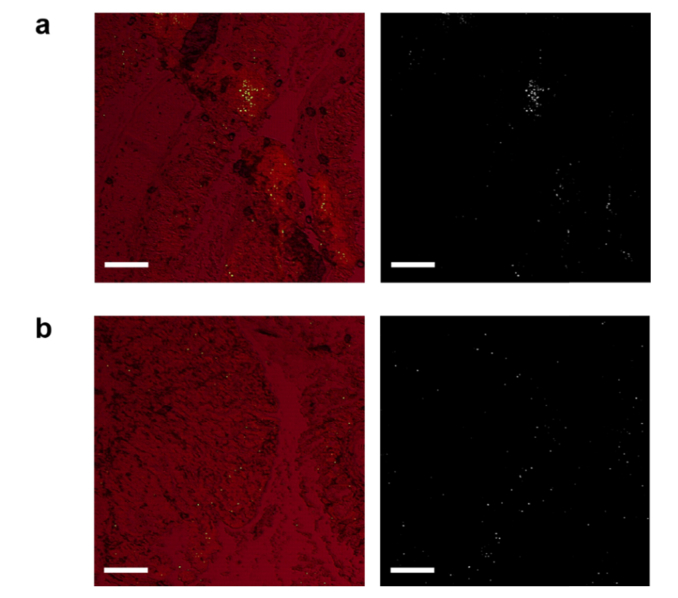
Fig. 11.
a, (Left) Representative laser emission image of an adenoma tissue overlaid with the corresponding brightfield image. (Right) The laser emission image alone. b, (Left) Representative laser emission image of a normal tissue adjacent to adenoma overlaid with the corresponding brightfield image. (Right) The laser emission image alone. The LEM images were scanned and measured under a pump energy density of 45 µJ/mm2. Scale bars, 200 µm.

