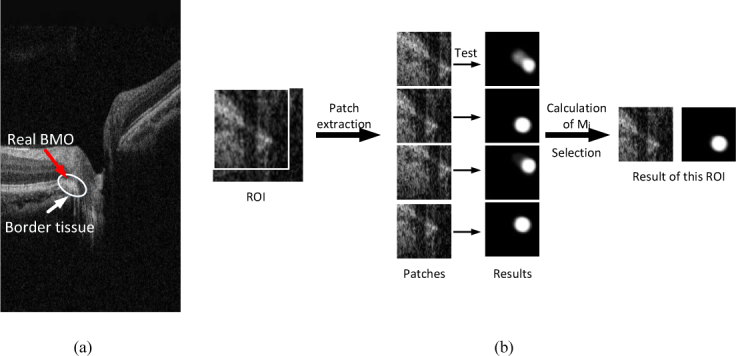
Fig. 5.

Illustration of the border tissue and the post-processing steps. (a) The sketch map of ambiguous border tissue. The real BMO is confused by the border tissue in this case. (b) The sketch map of post-processing. There are four patches (the box in the ROI indicate the upper left patch) extracted in the ROI and send to the trained U-net, the mask of patches with maximum Mi is selected as the result and its center point is the final result of BMO.
