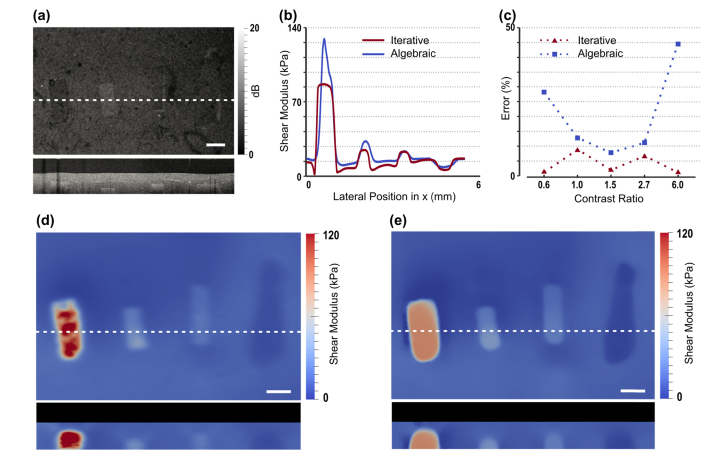
Fig. 2.
Tissue-mimicking phantoms with multiple inclusions of varying shear modulus. (a) OCT structural image, showing en face (upper) and cross-sectional views. (b) Plots of reconstructed shear modulus along the white-dashed line in (a) using the iterative and algebraic methods. (c) The error in the estimated shear modulus compared with experimentally measured values with respect to the contrast ratio in modulus between the inclusion and the surrounding material. (d) and (e) are corresponding maps of shear modulus (en face and cross-sectional views) reconstructed using the algebraic and iterative methods, respectively. Scale bars are 500 µm.

