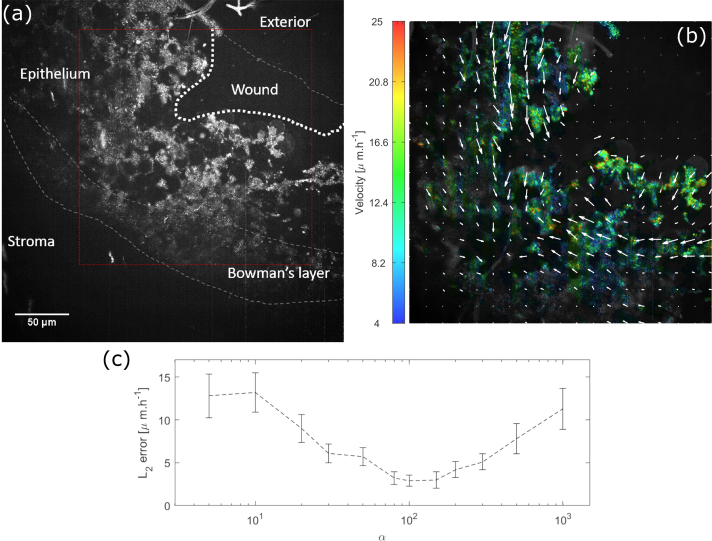
Fig. 3.
(a) Dynamic grayscale image of a wounded macaque cornea - the red box shows where the computation is done, see Visualization 1 (4.4MB, mp4) (b) Same dynamic image superimposed with colors coding for the cell migration velocity averaged over the 112 minute acquisition. Each arrow represents the mean motion in a pixel - (c) Velocity errors for different Horn-Shunk smoothness terms α. The curve represents the mean error we found by comparing the optical flow computation with 200 manually tracked voxels. Error-bars represent the error standard deviation. The optimal α was found to be 100.

