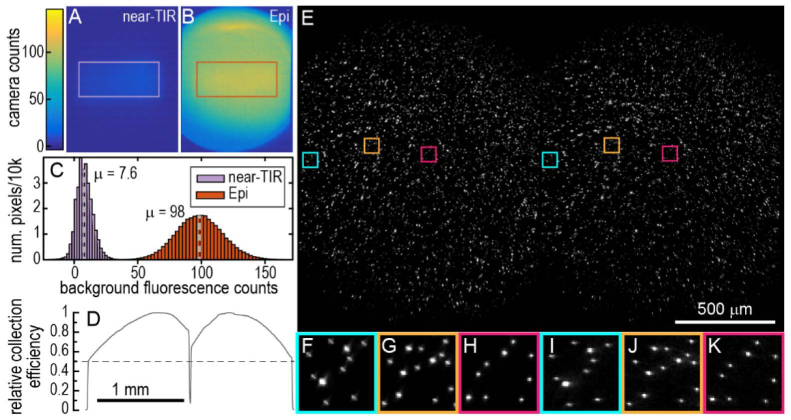
Fig. 2.
Optical characterization. Images in the QuasAr fluorescence channel of a pristine, empty cyclic olefin copolymer (COC) substrate illuminated by a 638 nm laser routed (A) through the prism at near-TIR and (B) through the objective in traditional Epi illumination. For both light paths, the 638 nm laser was apertured to illuminate exactly the same area, and the laser power in both paths was tuned to match illumination intensities. Counts in the Epi sample were scaled so that the median of measured bead intensities in a separate sample (after background subtraction) matched between Epi and near-TIR illumination. In near-TIR illumination, there is a small amount of background from the immersion oil and substrate. In Epi illumination, there is a much larger amount of out-of-focus autofluorescence from glass in the objective, still present when the sample is removed entirely. (C) The histogram of pixel intensities after background subtraction from the rectangles shown in A and B show 13x lower autofluorescence in the near-TIR illumination geometry. (D) The light collection efficiency of the 2 fluorescence imaging pathways [QuasAr left, GFP right]. A relatively homogeneous fluorescent orange paper sample was illuminated by an oversized, homogeneous LED source from above. Images were captured at many locations within the paper and averaged to minimize effects of sample inhomogeneity. The lineout reveals some light loss from the objective where the colors are still colinear and some light loss in the dual-view path after the colors have been separated. (E) A dualview image of 1 um Tetraspeck beads emitting multiple fluorescent colors is captured on the bottom camera (of Fig. 1(B)). The image spans the full camera width and shows the 1.2 mm wide FOV for both the QuasAr channel (left) and the GFP channel (right). The dichroic reflecting green light to the first camera was removed. Each half of the image has been independently background subtracted and contrasted. Expanded views of indicated sub-regions in (E) for red (F - H) and green (I - K) fluorescence channels. Expanded images from each fluorescence channel are shown with the same brightness and contrast values.

