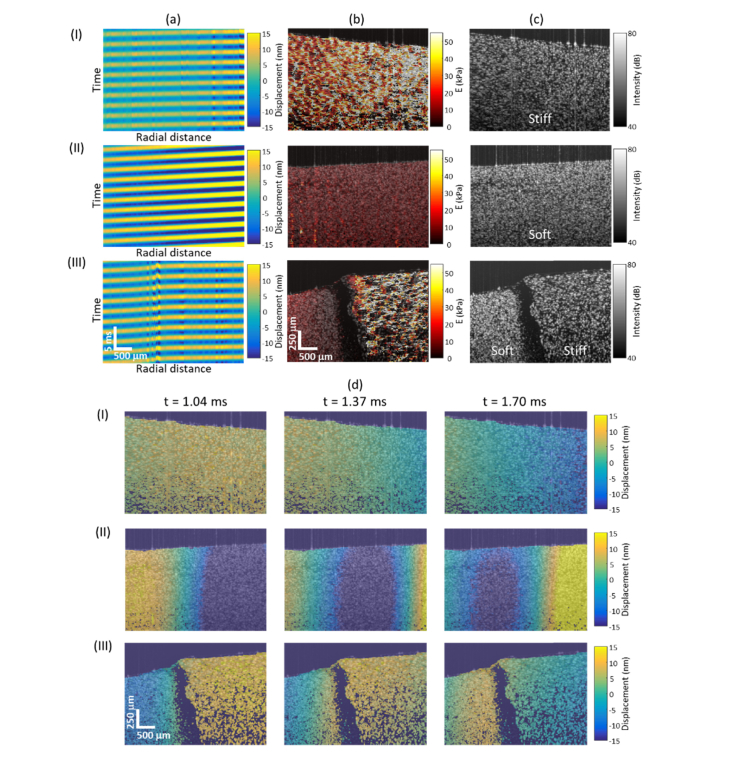
Fig. 2.
Representative PDMS phantom results. (a) Space-time plots, (b) reconstructed Young’s modulus () maps, (c) structural OCT images, and (d) shear wave propagation (full video shown in Visualization 1 (5MB, mp4) at 120 fps) of the (I) uniformly stiff, (II) uniformly soft, and (III) heterogeneous soft-stiff (left-right) samples.

