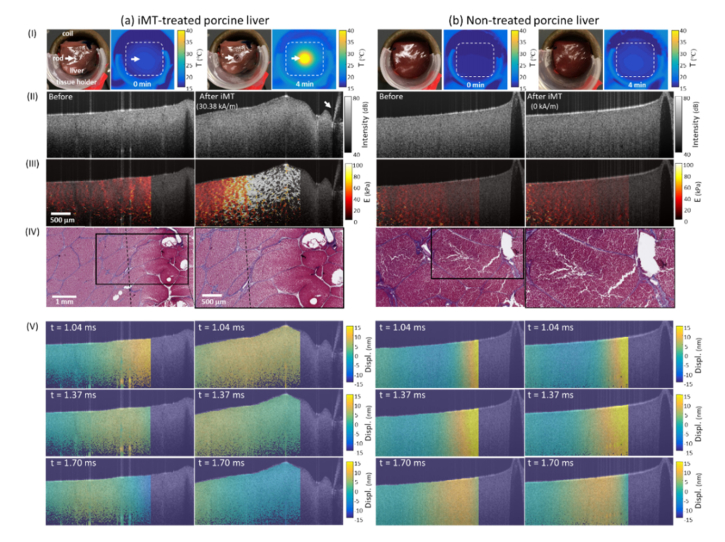
Fig. 4.
Representative results of (a) iMT-treated and (b) non-treated porcine liver specimens. (I) Photographs obtained (left) before and (right) after treatment; thermal images acquired at the (left) 0th and (right) 4th min of the treatment. (II) Structural OCT images and (III) reconstructed Young’s modulus () maps obtained (left) before and (right) after iMT treatment. White arrows in (I) and (II) indicate the locations of the magnetic thermoseed. (IV) (Left) Post-treatment Masson Trichrome-stained histology and (right) a zoomed-in area. Collagen is stained blue. The ablation zone was delineated with the dashed line. (V) Shear wave propagation captured at different temporal instants were also visualized (full video shown in Visualization 2 (5.8MB, mp4) at 120 fps).

