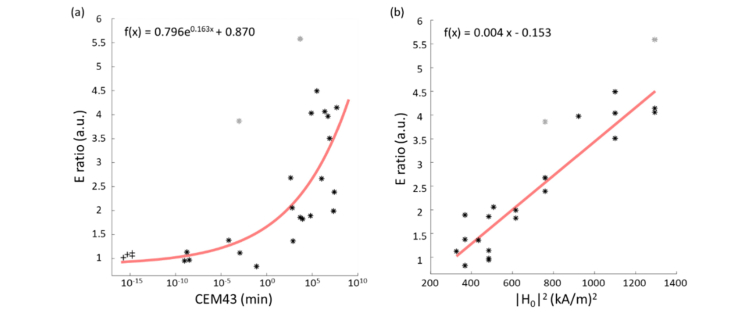
Fig. 5.
Correlation between (a) Young’s modulus ratio (ratio) and CEM43 (Pearson’s r = 0.799), and (b) ratio and squared magnetic field strength () (Pearson’s r = 0.938) in porcine liver specimens. Note that outliers (indicated in gray) were excluded from the fitting and ‘ + ’ denotes the non-treated tissues. The outliers were defined as the datapoints which deviated from the baseline model by 1.5 standard deviations. Sample size of the non-treated and treated samples were 4 and 23, respectively.

