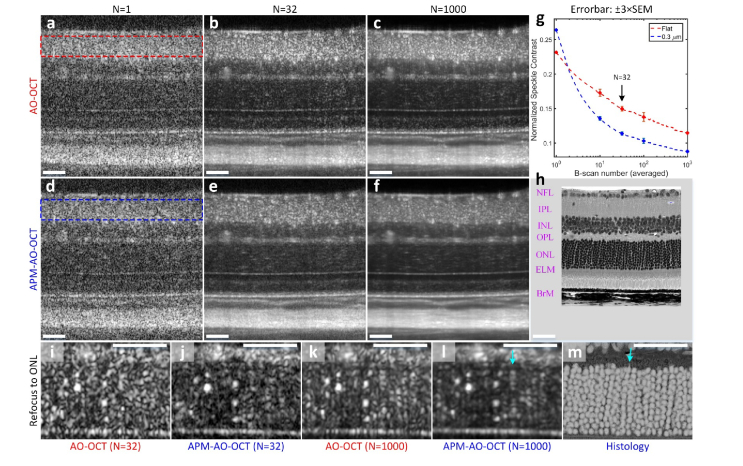
Fig. 5.
Comparison of the efficiency of the averaging of APM-AO-OCT vs AO-OCT results in reducing speckle and revealing novel cellular structure in vivo. (a-c), AO-OCT B-scans with N representing the number of images averaged. (d-f), APM-AO-OCT B-scans with sample averaging corresponding to that used in panels (a-c). The data in these panels were acquired with interlaced protocol. The focus of the AO-system was set to the IPL. The retinal layers are indicated in (h), which is provided at the same scale as the OCT B-scans. (g), Normalized speckle contrast of the IPL, for AO-OCT (red rectangle in a; red symbols and line in g) and for APM-AO-OCT (blue rectangle in d; blue symbols and line in g), plotted as function of the number of B-scan averaged. (h), Retinal plastic section of a C57Bl/6 mouse imaged with a 40X objective in a Nikon A1 microscope. (i-l), Averaged B-scans with the focus of the AO system shifted to the ONL; the shifted focus both increases the overall brightness of the images and narrows the width of the ONL scattering spots relative to those in panels (a-f). (m), Histology of the ONL from (h) presented with inverted contrast and magnified so as to have the same scale as panels (i-l); scale bar 50 μm. Cyan arrow in (l) points to a periodic series of spots which is very similar to stacks of rod cell bodies in m. Abbreviations: NFL - nerve fiber layer, IPL - inner plexiform layer, INL - inner nuclear layer, OPL - outer plexiform layer, ONL - outer nuclear layer, ELM - external limiting membrane, BrM - Bruch’s membrane. For APM-OCT, the top 10% mirror configurations were used (DM displacement range: 0.3 μm).

