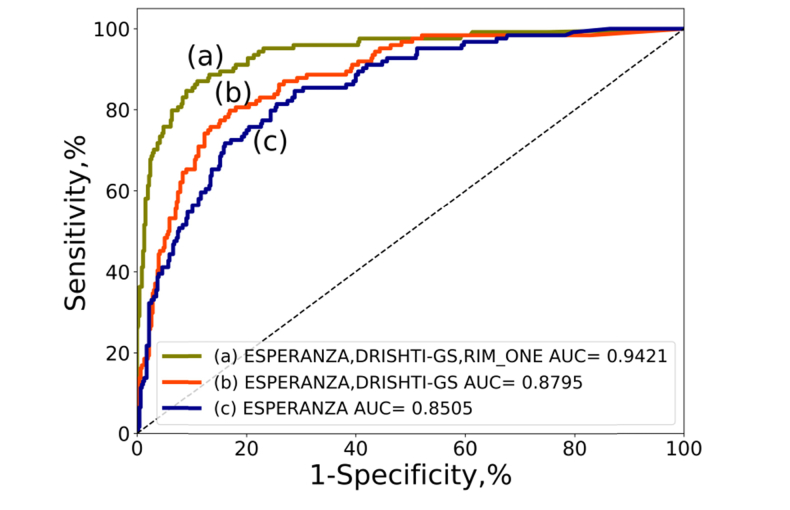
Fig. 9.
ROC curves and AUC values using always the test set of Table 5 and training VGG19 with fine tuning and 100 epochs. The red line represents the ROC curve using the network trained only with the EPSERANZA data set. The blue line is the result after training with ESPERANZA and DRISHTI-GS data sets and the green line is the ROC curve after training using all the data sets of the study: ESPERANZA, DRISHTI-GS and RIM-ONE.

