

Abstract
Fetal alcohol spectrum disorders (FASD) are characterized by impairment in cognitive function that may or may not be accompanied by craniofacial anomalies, microcephaly, and/or growth retardation. Resting‐state functional MRI (rs‐fMRI), which examines the low‐frequency component of the blood oxygen level dependent (BOLD) signal in the absence of an explicit task, provides an efficient and powerful mechanism for studying functional brain networks even in low‐functioning and young subjects. Studies using independent component analysis (ICA) have identified a set of resting‐state networks (RSNs) that have been linked to distinct domains of cognitive and perceptual function, which are believed to reflect the intrinsic functional architecture of the brain. This study is the first to examine resting‐state functional connectivity within these RSNs in FASD. Rs‐fMRI scans were performed on 38 children with FASD (19 with either full fetal alcohol syndrome (FAS) or partial FAS (PFAS), 19 nonsyndromal heavily exposed (HE)), and 19 controls, mean age 11.3 ± 0.9 years, from the Cape Town Longitudinal Cohort. Nine resting‐state networks were generated by ICA. Voxelwise group comparison between a combined FAS/PFAS group and controls revealed localized dose‐dependent functional connectivity reductions in five regions in separate networks: anterior default mode, salience, ventral and dorsal attention, and R executive control. The former three also showed lower connectivity in the HE group. Gray matter connectivity deficits in four of the five networks appear to be related to deficits in white matter tracts that provide intra‐RSN connections. Hum Brain Mapp 38:5217–5233, 2017. © 2017 Wiley Periodicals, Inc.
Keywords: resting‐state functional MRI, fractional amplitude of low‐frequency fluctuation, regional homogeneity, resting‐state functional connectivity, fetal alcohol spectrum disorders
INTRODUCTION
Prenatal alcohol exposure (PAE) is associated with a wide range of life‐long cognitive and behavioral impairments, including lower IQ, poorer attention, executive functioning, and learning and memory, slower processing speed, and poorer adaptive functioning and social skills [Coles et al., 1997; Dodge et al., 2014; Jacobson et al., 2004, 2008; Kalberg et al., 2006; Mattson et al., 2011; Streissguth et al., 1994]. Fetal alcohol syndrome (FAS), the most severe of the fetal alcohol spectrum disorders (FASD), is characterized by small head circumference, growth retardation and distinctive facial features, including short palpebral fissures, an indistinct (i.e., flat or smooth) philtrum, and a thin vermillion [Hoyme et al., 2005]. Partial FAS (PFAS) is diagnosed when there is evidence of maternal alcohol consumption during pregnancy, and the child exhibits alcohol‐related facial anomalies and at least one of the following—small head circumference, growth retardation, or neurobehavioral deficits. Exposed individuals who lack the characteristic facial dysmorphology but exhibit neurobehavioral deficits are diagnosed with alcohol‐related neurodevelopmental disorder (ARND).
Resting‐state functional MRI (rs‐fMRI) has been widely used to study functionally connected regions of the brain while a subject is not performing any explicit task. The method, first proposed by Biswal et al. [1995], focuses on spontaneous low frequency fluctuations (LFFs, <0.1 Hz) in the measured blood oxygen level dependent (BOLD) signal. Given the variability in motivation to perform cognitive tasks in the scanner and high rate of task‐induced motion in children, the task‐free nature of rs‐fMRI makes it an ideal tool for studying pediatric populations [Stevens et al., 2009; Supekar et al., 2009]. Resting‐state functional connectivity (RSFC) is used to identify and quantify resting‐state networks (RSNs). About 15–20 RSNs have been identified with reliability, reproducibility, and consistency across subjects [e.g., Beckmann et al., 2005; Smith et al., 2004], stages of cognitive development [Fair et al., 2007; Fransson et al., 2007], degree of consciousness [Boly et al., 2008; Greicius et al., 2008], and even across species [Vincent et al., 2007]. The RSNs have been associated with a range of neurobehavioral functions, including visual, somatosensory, attention [Rosazza and Minati, 2011] and executive function [Seeley et al., 2007]. The default mode network (DMN) is active when the subject is not focused on the external environment and, in contrast to other networks, shows suspended instead of increased activity during goal‐directed tasks [Bonnelle et al., 2011; Buckner et al., 2008; Raichle et al., 2001]. Rs‐fMRI facilitates examination of the intrinsic functional architecture of the brain at its highest organizational level across these large‐scale networks.
Several methods are available for identifying the extent of RSNs and for quantifying RSFC. At the network level, various mathematical methods have been applied, including independent component analysis (ICA) [Beckmann et al., 2005; Damoiseaux et al, 2006] and seed‐based analysis [Biswal et al., 1995]. ICA, used here, decomposes a data matrix into distinct spatial maps, that is, (statistically) independent components (ICs), each with an associated time series. ICs can then be thresholded for high connectivity values to define the boundaries of the networks.
Several voxelwise parameters have been developed for quantifying local RSFC properties. Regional homogeneity (ReHo) measures the similarity or synchronization between the time series of a given voxel and its nearest neighbors [Zang et al., 2004]. Amplitude of low‐frequency fluctuation (ALFF) evaluates the strength or intensity of LFFs [Zang et al., 2007], and fractional ALFF (fALFF) represents the relative contribution of the LFF band to the whole observed frequency range [Zou et al., 2008].
Rs‐fMRI has previously been applied in only a few PAE studies. Wozniak et al. [2011] observed decreased interhemispheric functional connectivity in children (age 10–17 yr) with FASD, comparing average time series correlation in specific regions of interest (ROIs) connected by the corpus callosum. Later, in a whole brain study using graph theory, they reported decreased global efficiency and increased path length in children with FASD [Wozniak et al., 2013]. Santhanam et al. [2011] compared prenatally exposed young adults with and without facial dysmorphology to community‐matched controls using seed‐based analysis and reported reduced RSFC in the DMN.
This is the first study of FASD to use ICA to characterize the full range of RSNs, to examine the effects of PAE on their connectivity and extent, and to use prospectively ascertained continuous measures of prenatal alcohol exposure. We first describe the implementation of ICA and dual regression to determine functional networks and connectivity in a data‐driven manner. These networks are then used to compare alcohol‐exposed children with different diagnoses (a combined FAS and PFAS group and a nonsyndromal heavily exposed (HE) group) to community‐matched controls. Additionally, we examine the relation of RSFC measures in regions showing group differences with the extent of alcohol exposure, obtained from detailed drinking histories of the subjects' mothers who had been recruited during pregnancy as part of the Cape Town Longitudinal Study [Jacobson et al., 2008]. Finally, in previous diffusion tensor imaging (DTI) analyses of children from the Cape Town Longitudinal Cohort, we have found fetal alcohol‐related deficits in both cerebellar [Fan et al., 2015] and cerebral [Fan et al., 2016] white matter (WM). By combining the previous DTI results with data from this study, we examine the degree to which the observed functional connectivity deficits are associated with microstructural deficits in network‐related WM.
MATERIALS AND METHODS
Participants
Pregnant women were recruited for the Cape Town Longitudinal Cohort Study from the Cape Coloured (mixed ancestry) community in Cape Town, South Africa [Jacobson et al., 2008]. Women were at least 18 years of age and without diabetes, epilepsy, or cardiac problems requiring treatment. Incidence and amount of drinking on a day‐by‐day basis during a typical 2‐week period both at time of conception and at time of recruitment were determined using a timeline follow‐back interview [Jacobson et al., 2002]. This interview was repeated in mid‐pregnancy and again at 1 month postpartum to provide information about drinking during the latter part of pregnancy. Volume was recorded for each type of beverage consumed each day, converted to ounces (oz) absolute alcohol (AA), and summarized using three measures: oz AA consumed per day (AA/day), oz AA consumed per occasion, and number of drinking days per week. Any woman reporting at least 14 drinks per week (1.0 oz AA/day) or two incidents of binge drinking (≥5 drinks) per month during the first trimester of pregnancy was invited to participate in the study. Women who abstained from drinking or drank only minimally during pregnancy were recruited as controls. Smoking during pregnancy was reported in terms of cigarettes smoked per day; drug use, days used per week. The mother's age at delivery and years of education were also recorded. Each child was examined for growth and FAS dysmorphology by two dysmorphologists (HE Hoyme, MD, LK Robinson, MD) using the Revised Institute of Medicine (IOM) criteria [Hoyme et al., 2005] at an FAS diagnostic clinic held in 2005 [Jacobson et al., 2008]; one child, who could not attend the clinic was later examined at our UCT laboratory by a third dysmorphologist (N Khaole, MD) using the same criteria. There was substantial inter‐examiner agreement on the assessment of the principal fetal alcohol‐related dysmorphic features among the three expert FAS dysmorphologists. Following a case conference, each of the alcohol‐exposed children was assigned to one of three diagnostic groups: FAS, PFAS, or heavily exposed (HE) nonsyndromal. The sample comprised 10 children with FAS, 9 with PFAS, 19 HE, and 19 controls (Ctls).
Retrospective alcohol consumption data were obtained at 5 years postpartum for 4 of 5 subjects for whom maternal alcohol consumption data during pregnancy were missing. Based on the moderate‐to‐strong agreement between maternal reports obtained contemporaneously during pregnancy and 5‐year retrospective reports (r = 0.60, P < 0.0001), multiple regression was used to estimate the drinking levels these four mothers would have reported during pregnancy, adjusting for the general tendency of mothers to report higher levels of drinking retrospectively than contemporaneously [Jacobson et al., 2002]. The fifth child met the Revised IOM [Hoyme et al., 2005] diagnostic criteria for full fetal alcohol syndrome (FAS), despite her mother denying drinking during pregnancy. For this case, alcohol consumption was estimated by taking the median of the drinking levels reported by the mothers of the other children with full FAS.
Approval for human research was obtained from the Institutional Review Board of Wayne State University and the University of Cape Town Faculty of Health Sciences Human Research Ethics Committee. Informed consent was obtained from mothers at recruitment and at the child assessment visits; assent was obtained from the child. Children received a small gift, and mothers received a photo of their child and compensation consistent with guidelines from the ethics committees.
Procedures
Rs‐fMRI data were acquired in 57 right‐handed children (mean age at scan ± sd: 11.3 ± 0.9 yr). Handedness was assessed on the Edinburgh Behavioral Handedness Inventory (EHI) [Oldfield, 1971], which examines hand preference across a number of domains, such as writing, eating and sports [Annett, 1970]); there were no between‐group differences in degree of right‐handedness (F(2,54) <0.26, P = 0.769). IQ scores for these children were obtained on the Wechsler Intelligence Scale for Children‐IV (WISC‐IV) at age 10.2 ± 0.8 years during a separate assessment visit; postnatal lead exposure levels were ascertained from blood samples obtained from these children at age 5.1 ± 0.2 years.
Scanning Protocol
The children were scanned using a 3 T Allegra MRI (Siemens, Erlangen, Germany) located at the Cape Universities Brain Imaging Centre (CUBIC). Rs‐fMRI data were acquired using an echo planar imaging (EPI) sequence (resolution = 3.1 × 3.1 × 3.0 mm3, FOV = 200 × 200 × 152 mm3, 34 slices, 180 volumes, TR = 2000 ms, TE = 30 ms, flip angle 90°). T1‐weighted structural images were acquired in the sagittal orientation using a 3D EPI‐navigated multiecho magnetization prepared rapid gradient echo (MPRAGE) sequence (resolution = 1.3 × 1.3 × 1.0 mm3, FOV = 256 × 256 × 167 mm3, 128 slices, TR 2530 ms, TI 1100 ms, TEs 1.53/3.21/4.89/6.57 ms, flip angle 7°) [Tisdall et al., 2009; van der Kouwe et al., 2008].
Preprocessing and Statistical Analysis
A schematic diagram of the processing and analysis steps is provided in Figure 1. First, all rs‐fMRI data were preprocessed using a pipeline of standard procedures, which were constructed and implemented using afni_proc.py (Appendix 1) in AFNI [Cox, 1996]. The first 4 volumes were discarded to allow for signal stabilization. Remaining time points were despiked and motion corrected by rigid body volume registration. For each subject, the maximum translation in any direction was below 0.9 mm and the maximum rotation in any direction was below 1.0°. Both linear and nonlinear co‐registrations were applied to align each EPI set first to the subject's anatomical T1‐weighted structural image and then to the 3 × 3 × 3 mm3 Talairach–Tournoux (TT) standard space. Each volume was spatially blurred at a full width at half maximum (FWHM) of 6.0 mm. WM and cerebrospinal fluid (CSF) signals were regressed out, as well as motion estimates, and time series were band‐pass filtered between 0.01 and 0.1 Hz to reduce physiological contributions of respiratory and cardiovascular components. In the final preprocessing stage, the RSFC parameters—fALFF and ReHo—were calculated for each subject using FATCAT [Taylor and Saad, 2013].
Figure 1.
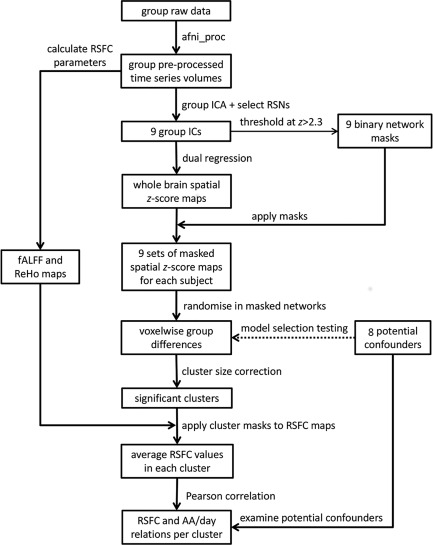
Processing and analysis pipeline.
Group ICA was performed using MELODIC in FSL to estimate resting‐state network (RSN) maps. Twenty independent components (ICs) were generated, based on standard dimensionality reduction used in rs‐fMRI studies of similar group size [Smith et al., 2009]. From these ICs, nine standard RSNs were identified by comparison with a standard set of 20 RSNs that had been calculated as part of the Functional Connectome Project (FCP) [Biswal et al., 2010]. The remaining ICs, which largely represented noise, alignment features, non‐gray‐matter tissue, and physiological signals, were not utilized in further analyses. The spatial extent of each network was defined by thresholding each group IC at a z‐score > 2.3 and creating a binary mask [Beckmann and Smith, 2004]. Dual regression [Beckmann et al., 2009] was performed to backproject the group ICs onto individual subject resting data, producing single subject connectivity maps for each RSN. The magnitude of the signal in each voxel in these connectivity maps reflect parameter estimates (PE), which are the non‐normalized betas from the GLMs in the second step of dual regression and provide a measure of the variance in the signal that is explained by a particular IC. Single‐subject connectivity maps were masked using the binary masks created from the group ICA.
For each network, the masked single‐subject parameter estimate (PE) maps were entered into FSL‐randomize for voxelwise modeling with GLMs to determine voxels with significant connectivity differences between each of the two FASD groups (FAS/PFAS and HE) and the Ctl group. AFNI's 3dFWHMx and 3dClustSim (v17.0.17) were used to calculate the minimum volume of clusters within each network mask for significance at voxelwise P = 0.001 and alpha = 0.05 using the new “mixed ACF” (autocorrelation function) methodology to account for non‐Gaussianity in the spatial noise distribution [Cox et al., 2017]. Appendix 2 provides the cluster size thresholds for each network.
We also investigated whether the inclusion of control variables in the voxelwise group comparisons altered the cluster results. The following control variables were examined: child sex, age at scan, postnatal lead exposure, and total gray matter (GM) volume, as well as maternal age at delivery, years of education, and cigarettes smoked per day during pregnancy. Missing demographic data were estimated as the median for the group (as noted in Table 1). Given the sensitivity of rs‐fMRI data to head motion, the maximum translation in any direction was also added as a control variable. Each of the eight control variables was included separately in the randomise model.
Table 1.
Sample characteristics (N = 57)
| FAS/PFAS | HE | Control | F or χ 2 | |
|---|---|---|---|---|
| N | 19 | 19 | 19 | |
| Child characteristics | ||||
| Sex (% male) | 47% | 42% | 26% | 1.93 |
| Age at rs‐fMRI scan (yr) | 11.0 (1.0) | 11.4 (0.7) | 11.6 (1.0) | 2.03 |
| Maximum translation in any direction during scan (mm) | 0.3 (0.1) | 0.3 (0.1) | 0.4 (0.1) | 1.94 |
| Lead exposurea | 9.9 (4.4) | 8.0 (2.7) | 7.5 (2.7) | 2.91 † |
| WISC‐IV IQ | 66.2 (9.5) | 76.6 (15.1) | 76.9 (13.1) | 4.31* |
| Total gray matter volume (×105 mm3)b | 6.6 (0.5) | 7.2 (0.7) | 6.8 (0.7) | 3.57* |
| Cortical gray matter volume (×105 mm3) | 5.0 (0.5) | 5.4 (0.6) | 5.1 (0.4) | 3.78* |
| Total white matter volume (×105 mm3)c | 3.8 (0.4) | 4.4 (0.6) | 4.3 (0.7) | 5.46** |
| Maternal characteristics | ||||
| Maternal age at delivery | 29.1 (7.6) | 24.8 (4.7) | 26.2 (4.6) | 2.72 † |
| Education (yr)d | 8.2 (2.7) | 9.0 (2.1) | 10.1 (1.7) | 3.51* |
| Absolute alcohol consumed per day across pregnancy (oz)e | 0.9 (0.8) | 0.8 (0.9) | 0.0 (0.0) | 10.10*** |
| Absolute alcohol consumed per occasion across pregnancy (oz)e | 4.0 (2.0) | 3.9 (3.2) | 0.1 (0.3) | 20.01*** |
| Drinking days per week across pregnancye | 1.5 (1.0) | 1.2 (0.9) | 0.0 (0.2) | 20.41*** |
| Cigarettes smoked per day during pregnancyf | 6.9 (6.1) | 5.4 (3.7) | 3.8 (9.9) | 0.91 |
† P < 0.10, *P < 0.05, **P < 0.01, ***P < 0.001. Values are mean (SD).
FAS/PFAS = combined group of full fetal alcohol syndrome (FAS) or partial FAS (PFAS). HE = nonsyndromal heavily exposed group. WISC‐IV = Wechsler Intellectual Scale for Children, 4th Edition. AA = absolute alcohol; 1 oz AA ≈ 2 standard drinks.
Missing value estimated at group median for 1 child with FAS/PFAS.
One (Ctl) outlier (3 SD beyond the mean) recoded to 1 point lower than the lowest observed nonoutlier group value [Winer et al., 1971].
One (Ctl) outlier recoded to 1 point higher than the highest observed nonoutlier group value.
One (FAS/PFAS) outlier recoded to 1 point lower than the lowest observed nonoutlier group value.
Maternal alcohol consumption during pregnancy was estimated from retrospective data obtained at 5 years postpartum for 4 of 5 subjects; maternal alcohol consumption for the mother of the fifth child who met diagnostic criteria for full fetal alcohol syndrome (FAS) but denied drinking was estimated at the median of the mothers of the other children with full FAS.
One (Ctl) outlier recoded to 1 point higher than the highest observed nonoutlier group value [Winer et al., 1971].
To investigate dose dependence in the clusters showing group differences in connectivity, we extracted mean RSFC parameters (PE, fALFF, and ReHo) in each cluster and examined associations with alcohol exposure averaged across pregnancy, AA/day. Any of the eight control variables specified above that was weakly associated (P < 0.1) with mean PE, fALFF, or ReHo in a cluster was considered a potential confounder of the association of alcohol with that parameter and included in a separate linear regression of the relation between AA/day and the parameter in that cluster. The statistical analyses were performed using SPSS (version 22). Analyses were rerun omitting the five children whose mothers admitted using cocaine, marijuana, or methaqualone to determine if the effects were altered.
Finally, we wanted to examine the extent to which functional connectivity differences between the alcohol‐exposed and Ctl groups observed here may be attributable to structural connectivity differences reported previously in cerebellar and whole brain DTI studies in children from the same cohort [Fan et al., 2015, 2016]. Full details regarding processing and analysis for these DTI studies are provided in the articles reporting those findings. Briefly, the acquired diffusion weighted images were first visually inspected to remove volumes with signal dropout. The data were then preprocessed with motion and susceptibility correction [Anderson et al., 2003] prior to tensor and parameter estimation. A groupwise WM map was created from the union of individual subject WM masks, generated from subject fractional anisotropy (FA) maps by thresholding at FA > 0.2. Voxelwise two sample (unpaired) t tests were performed using permutation tests (with FSL‐randomise) to identify regions within the groupwise WM mask showing FA and mean diffusivity (MD) differences between alcohol exposed and control children. These studies identified a total of 9 clusters showing alcohol‐related increases in MD: L and R inferior longitudinal fasciculus (L‐ILF and R‐ILF), splenium and isthmus of the corpus callosum (SCC and ICC), R superior longitudinal fasciculus (R‐SLF), L and R corticospinal tract (L‐CST and R‐CST), and L middle and R inferior peduncle. Although these studies also identified regions showing FA reductions, these were located primarily in the same regions showing MD increases; only the latter were, therefore, used to examine whether connectivity differences may be attributable to deficits in WM tracts involved in intra‐RSN connections. Of the children in this study, 20 (6 Ctl, 6 FAS, 5 PFAS, and 3 HE) were part of the cerebellar DTI study [Fan et al., 2015], and 21 (6 Ctl, 4 FAS, 7 PFAS, and 4 HE) of the whole‐brain DTI study [Fan et al., 2016]. We identified alcohol‐affected tracts that connect regions within networks showing functional connectivity reductions by overlaying clusters showing alcohol‐related MD increases and connectivity reductions on the MNI152 template space, together with relevant WM tracts and rs‐fMRI networks. WM tracts were manually drawn using an FA‐skeleton template (FMRIU58_FA‐skeleton) in FSL.
RESULTS
Sample Characteristics
Demographic background information is summarized in Table 1. There were no significant between‐group differences in sex, age at scanning, motion during the scan, lead exposure, maternal age, or cigarette smoking during pregnancy. The children with FAS/PFAS had lower IQ scores and total WM volumes than the children in both the HE and control groups (Ps < 0.05). In contrast, total GM and cortical GM volumes of the children in the FAS/PFAS group were lower only compared to HE children (P < 0.05). As per the study design, maternal alcohol consumption was higher in the FAS/PFAS and HE groups. All mothers in the Ctl group reported abstaining from alcohol during pregnancy, except for one who reported drinking 1 drink on four occasions. One mother of a child with FAS used methaqualone during pregnancy; mothers of two children with PFAS used either marijuana or methaqualone; and mothers of two HE children used both marijuana and methaqualone.
Resting‐State Networks Generated by the ICA
Figure 2 shows the nine resting‐state networks generated by the ICA, arranged by decreasing degree of variance explained in the initial principal component analysis (PCA). The first five networks generated by the PCA were salience, visual, posterior and anterior DMN, and somatosensory. In addition, four networks relating to cognition and attention were generated—right (R) executive control, dorsal attention, left (L) executive control, and ventral attention. As often seen in children, connectivity within the DMN was not fully integrated [de Bie et al., 2012] and two distinct regions were evident—the anterior region, which includes the ventral medial frontal cortex and is activated during mentalizing or reflecting on mental states of others, perception and judgments of other people, self‐knowledge, and self‐referential processing, and the posterior region, which includes the posterior cingulate and precuneus and is associated with episodic memory retrieval and visuo‐spatial imagery [Uddin et al., 2009].
Figure 2.
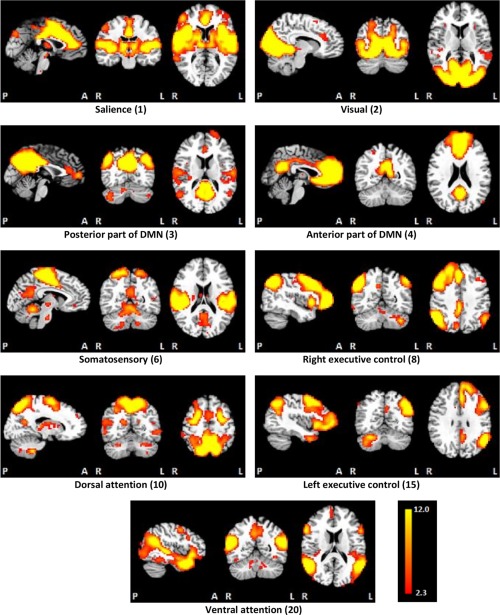
The nine resting‐state networks generated by the independent components analysis, ordered in terms of the amount of variance explained by the initial principal components analysis. [Color figure can be viewed at http://wileyonlinelibrary.com]
Resting‐State Functional Connectivity Group Comparisons
Voxelwise group comparisons of the PE maps revealed significant reductions (P < 0.001) in connectivity in the children with FAS/PFAS compared to the Ctls in five localized regions within separate networks (Fig. 3). These clusters were located within the R postcentral gyrus in the anterior DMN, the R middle frontal gyrus in the salience network, the R precentral gyrus in the ventral attention network, the L precentral gyrus in the dorsal attention network, and L crus II in the R executive control network. The peak coordinates and sizes of these clusters are given in Table 2, as well as the group means of the average PE, fALFF and ReHo in each cluster, and relations of the cluster means to extent of PAE (AA/day). Increasing alcohol exposure was associated with reduced PE and fALFF values in the clusters in the default mode, salience, ventral attention, and dorsal attention networks and with reduced ReHo in the clusters in the default mode and salience networks.
Figure 3.
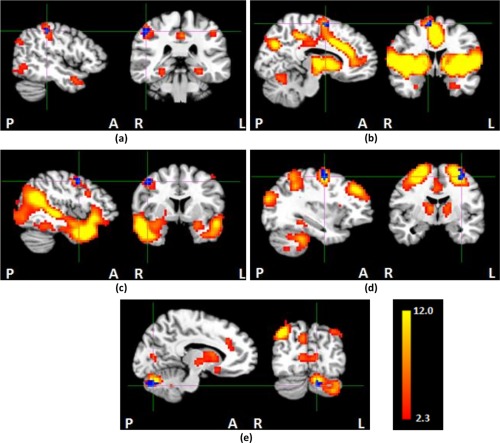
Each panel shows the group ICA map of a resting‐state network thresholded at z > 2.3 (hot colors) and clusters in which children with FAS/PFAS had lower connectivity than controls (in blue; cross‐hairs indicate the peak coordinates). (a) R postcentral gyrus within the anterior DMN, (b) R middle frontal gyrus within the salience network, (c) R precentral gyrus within the ventral attention network, (d) L precentral gyrus within the dorsal attention network, and (e) L crus II within the R executive control network. [Color figure can be viewed at http://wileyonlinelibrary.com]
Table 2.
Size and peak coordinates (in TT standard space) of regions in different resting‐state networks showing reduced connectivity in children with FAS/PFAS compared to control children. Also shown are relations of levels of prenatal alcohol exposure to the cluster averages for the different RSFC parameters
| Group Means (SD) of Cluster Averages for different RSFC parameters | |||||||
|---|---|---|---|---|---|---|---|
| Network Peak coordinates (mm) | Cluster Size (mm3) | RSFC parameter | FAS/PFAS | HE | Ctl | F | Correlation of Cluster Averages with AA/day |
| Anterior DMN a | |||||||
| 46.5, −31.5, 44.5 | 540 | PE | 0.50 (0.24) | 0.53 (0.36) | 0.97 (0.55) | 8.28*** | −0.42** |
| fALFF | 0.40 (0.02) | 0.41 (0.02) | 0.43 (0.02) | 11.04*** | −0.44*** | ||
| ReHo | 0.51 (0.04) | 0.52 (0.07) | 0.58 (0.05) | 9.93*** | −0.34** | ||
| Salience b | |||||||
| 10.5, −1.5, 59.5 | 351 | PE | 0.65 (0.26) | 0.65 (0.33) | 1.01 (0.38) | 7.94*** | −0.47*** |
| fALFF | 0.39 (0.03) | 0.40 (0.03) | 0.44 (0.02) | 14.44*** | −0.53*** | ||
| ReHo | 0.48 (0.06) | 0.49 (0.08) | 0.58 (0.06) | 11.01*** | −0.39** | ||
| Ventral attention c | |||||||
| 43.5, −7.5, 44.5 | 729 | PE | 0.46 (0.22) | 0.43 (0.24) | 0.77 (0.36) | 8.63*** | −0.30* |
| fALFF | 0.40 (0.04) | 0.41 (0.03) | 0.41 (0.04) | 1.48 | −0.27* | ||
| ReHo | 0.56 (0.07) | 0.55 (0.08) | 0.56 (0.06) | 0.11 | −0.03 | ||
| Dorsal attention | |||||||
| −31.5, −7.5, 53.5 | 486 | PE | 0.40 (0.17) | 0.55 (0.28) | 0.67 (0.37) | 4.12* | −0.30* |
| fALFF | 0.46 (0.04) | 0.46 (0.03) | 0.48 (0.04) | 2.76† | −0.29* | ||
| ReHo | 0.63 (0.08) | 0.60 (0.07) | 0.66 (0.07) | 3.01* | −0.10 | ||
| Right executive control | |||||||
| −10.5, −73.5, −30.5 | 675 | PE | 0.38 (0.16) | 0.54 (0.26) | 0.63 (0.34) | 4.16* | −0.23 † |
| fALFF | 0.41 (0.03) | 0.40 (0.03) | 0.41 (0.03) | 1.58 | −0.24 † | ||
| ReHo | 0.51 (0.06) | 0.53 (0.09) | 0.54 (0.07) | 0.57 | −0.06 | ||
† P < 0.10, *P < 0.05, **P < 0.01, ***P < 0.001.
FAS/PFAS = combined group comprising children with full fetal alcohol syndrome (FAS) or partial FAS (PFAS); HE = nonsyndromal heavily exposed group; PE = parameter estimates; fALFF = fractional amplitude of low‐frequency fluctuations; ReHo = regional homogeneity; AA/day = absolute alcohol consumed per day across pregnancy.
A similar cluster (405 mm3; peak coordinates 52.5, −28.5, 38.5) showed lower connectivity in HE than control children.
A similar cluster (891 mm3; peak coordinates 7.5, 1.5, 53.5) showed lower connectivity in HE than control children.
A similar cluster (513 mm3; peak coordinates 40.5, −7.5, 44.5) showed lower connectivity in HE than control children.
When compared with Ctls, the HE group showed lower RSFC in three regions within three networks. Notably, each of these regions overlapped with an FAS/PFAS‐derived cluster within the same network. These clusters were located in the R postcentral gyrus within the anterior DMN, the R middle frontal gyrus within salience, and the R precentral gyrus within ventral attention. Given their overlap with the previously derived clusters, they were not separately investigated further.
None of the voxelwise alcohol‐exposed versus Ctl group comparisons differed significantly from the original model when randomise was rerun with each control variable added separately (Appendix 3). Although the sizes of the clusters obtained from the voxelwise analyses varied with the inclusion of individual control variables, the peak coordinates remained the same, all except one cluster in the salience network remained significant, and no new clusters were revealed.
Table 3 presents the correlations of each of the control variables with mean PE, fALFF and ReHo values in the five clusters showing reduced connectivity in children with FAS/PFAS. When the potential confounders were included in linear regression analyses (Table 4), the associations of all three RSFC parameters with prenatal alcohol exposure remained essentially unchanged in the default mode and salience network clusters, and associations of PE with prenatal alcohol exposure in the clusters in the other networks. In contrast, after control for lead exposure, the association of AA/day with fALFF in the R precentral gyrus cluster in the ventral attention network was no longer significant, but the associations with fALFF and ReHo in the L precentral gyrus cluster within the dorsal attention network became stronger. Effects were essentially unchanged when the analyses were rerun omitting the three children with FAS/PFAS whose mothers admitted using cocaine, marijuana, or methaqualone and the two HE children whose mothers reported using both marijuana and methaqualone.
Table 3.
Correlation of each of the eight control variables with the mean PE, fALFF, and ReHo in the clusters showing alcohol‐related reductions in connectivity
| RSFC parameters Networks | Child sex | Child age at scan | Lead exposure | Maximum translation in any direction | Total GM volume | Maternal age | Maternal education | Smoking during pregnancy |
|---|---|---|---|---|---|---|---|---|
| PE | ||||||||
| Anterior DMN | 0.04 | −0.04 | −0.29* | 0.13 | −0.04 | −0.07 | 0.04 | −0.08 |
| Salience | 0.08 | −0.02 | −0.29* | −0.04 | −0.08 | −0.10 | 0.04 | −0.13 |
| Ventral attention | 0.07 | 0.21 | −0.11 | −0.22 | −0.06 | 0.01 | 0.10 | −0.11 |
| Dorsal attention | −0.13 | 0.02 | 0.04 | −0.04 | 0.18 | 0.01 | 0.25† | −0.18 |
| R executive control | 0.12 | 0.08 | −0.19 | −0.20 | −0.01 | 0.01 | 0.23† | −0.17 |
| fALFF | ||||||||
| Anterior DMN | 0.23† | 0.18 | −0.23† | −0.11 | −0.01 | 0.12 | 0.28* | −0.19 |
| Salience | 0.25† | 0.10 | −0.22 | −0.18 | 0.01 | −0.11 | 0.30* | −0.22 |
| Ventral attention | 0.06 | 0.11 | −0.44*** | −0.09 | 0.11 | −0.16 | 0.09 | −0.15 |
| Dorsal attention | −0.02 | 0.16 | 0.31* | −0.17 | −0.18 | −0.02 | 0.08 | −0.12 |
| R executive control | 0.19 | 0.11 | −0.07 | −0.04 | −0.12 | −0.07 | 0.07 | −0.10 |
| ReHo | ||||||||
| Anterior DMN | 0.13 | 0.26† | −0.13 | 0.07 | −0.14 | −0.15 | 0.09 | −0.08 |
| Salience | 0.14 | 0.25† | −0.16 | −0.01 | −0.13 | −0.16 | 0.11 | −0.12 |
| Ventral attention | −0.07 | 0.20 | −0.06 | 0.15 | −0.12 | −0.06 | −0.06 | −0.07 |
| Dorsal attention | −0.13 | 0.15 | 0.38*** | −0.02 | −0.16 | 0.23† | −0.09 | 0.07 |
| R executive control | 0.06 | 0.24† | −0.05 | 0.01 | 0.11 | 0.02 | 0.02 | 0.04 |
Values are Pearson rs; † P < 0.10, *P < 0.05, **P < 0.01, ***P < 0.001.
GM = gray matter; PE = parameter estimates; fALFF = fractional amplitude of low‐frequency fluctuations; ReHo = regional homogeneity.
Table 4.
Relation of extent of prenatal alcohol exposure to cluster averages of RSFC parameters (PE, fALFF, and ReHo) in regions showing alcohol‐related connectivity differences while controlling for potential confounders
| RSFC parameters Networks | Potential confounders | oz AA/day | |
|---|---|---|---|
| r | β | ||
| PE | |||
| Anterior DMN | Lead exposure | −0.42** | −0.36** |
| Salience | Lead exposure | −0.47*** | −0.42** |
| Ventral attention | None | −0.30* | −0.30* |
| Dorsal attention | maternal education | −0.30* | −0.33* |
| R executive control | maternal education | −0.23† | −0.25† |
| fALFF | |||
| Anterior DMN | Child sex, lead exposure, maternal education | −0.44*** | −0.45*** |
| Salience | Child sex, maternal education | −0.53*** | −0.53*** |
| Ventral attention | Lead exposure | −0.29* | −0.14 |
| Dorsal attention | Lead exposure | −0.29* | −0.42** |
| R executive control | None | −0.24† | −0.24† |
| ReHo | |||
| Anterior DMN | Child age | −0.34** | −0.33* |
| Salience | Child age | −0.39** | −0.38** |
| Ventral attention | None | −0.03 | −0.03 |
| Dorsal attention | Lead exposure, maternal age | −0.10 | −0.30* |
| R executive control | Child age | −0.06 | −0.05 |
† P <0.10, *P < 0.05, **P < 0.01, ***P < 0.001.
r is the simple pearson correlation between alcohol exposure and the RSFC parameters; β is the standardized regression coefficient after adjustment for the potential confounding variables.
PE = parameter estimates; fALFF = fractional amplitude of low‐frequency fluctuations; ReHo = regional homogeneity.
AA/day = absolute alcohol consumed per day across pregnancy.
Alcohol‐Affected Tracts Connect Regions Within Affected Networks
Figure 4 shows that four of the regions showing alcohol‐related reductions in functional connectivity are connected to other regions within their respective networks by three of the 9 WM tracts shown previously to be affected by prenatal alcohol exposure [Fan et al., 2015, 2016]. The R superior longitudinal fasciculus, in which children with FAS/PFAS revealed increased mean diffusivity (MD), connects regions with reduced RSFC to other regions in the default mode (Fig. 4a) and ventral attention (Fig. 4c) networks. The R corticospinal tract in which increased MD was observed in both the FAS/PFAS and HE groups compared to controls connects regions within the salience network (Fig. 4b). The region in the L middle cerebellar peduncle revealing higher MD in children with FAS/PFAS is adjacent to the GM cluster showing lower RSFC within the R executive control network (Fig. 4d).
Figure 4.
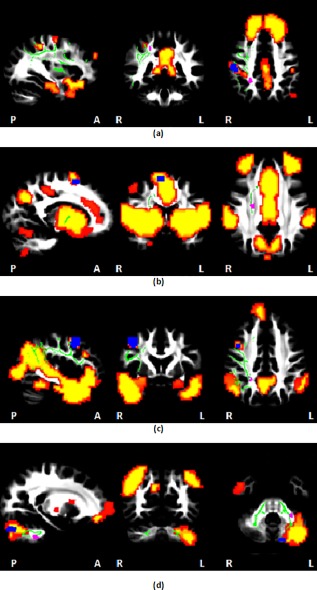
Regions showing functional connectivity reductions (blue) and MD increases (purple) in PAE children compared to controls overlaid on MNI152 template space, together with relevant WM tracts (green) and rs‐fMRI networks (hot colors): (a) the R superior longitudinal fasciculus [Fan et al., 2016] connects regions of the DMN; (b) the R corticospinal tract [Fan et al., 2016] connects regions of the salience network; (c) the R superior longitudinal fasciculus [Fan et al., 2016] connects regions of the ventral attention network; (d) the L middle cerebellar peduncle [Fan et al., 2015] connects regions of the R executive control network. WM tracts were manually drawn using an FA‐skeleton template (FMRIU58_FA‐skeleton) in FSL. [Color figure can be viewed at http://wileyonlinelibrary.com]
DISCUSSION
This is the first rs‐fMRI study to use group ICA and dual regression to quantitatively assess the effects of prenatal alcohol exposure on multiple RSNs. Voxelwise group comparison showed lower resting‐state connectivity in five regions within five networks in children with FAS/PFAS compared to nonexposed or minimally exposed Ctls. The following regions and networks were identified: R postcentral gyrus in anterior DMN, R middle frontal gyrus in salience, R precentral gyrus in ventral attention, L precentral gyrus in dorsal attention, and L crus II in R executive control. HE children also showed lower connectivity in three ROIs, which overlapped with those of the FAS/PFAS group in the default mode, salience, and ventral attention networks. The smaller number of regions showing reduced connectivity compared to controls in the HE group is consistent with the less severe neurobehavioral impairment in the nonsyndromal HE group.
The reduced connectivity found in the anterior DMN is consistent with the results of a previous fMRI study in which adults with FASD showed less DMN deactivation during a task compared to controls [Santhanam et al., 2011]. Although few FASD investigations have examined rs‐fMRI, several studies have reported effects of prenatal alcohol exposure on brain structure and activation during task‐based fMRI in the same cortical regions in which lower RSFC was found in this study. Reduced cortical GM thickness has been reported in R postcentral gyrus, R middle frontal gyrus, and R and L precentral gyrus in individuals with FASD between 6 and 30 years of age [Zhou et al., 2011] and in R postcentral gyrus in our Cape Town Longitudinal Cohort [Robertson et al., 2015]. Children and adolescents with FASD were also found to have greater BOLD response in the R middle frontal gyrus during a response inhibition (go/no‐go) task [Fryer et al., 2007]. An fMRI investigation of an overlapping subsample of children from our cohort found less BOLD activation in R crus I in children with FASD during a rhythmic finger tapping task [du Plessis et al., 2014]. The neighboring crus I and crus II regions are both parts of the executive control network [Bernard and Mittal, 2014; Habas et al., 2009], and deficits in executive function and attention have consistently been reported in FASD [Mattson et al., 2011].
The DMN is activated during rest and deactivated when individuals perform a task [Binder et al., 1999; Raichle et al., 2001; Shulman et al., 1997]. In addition, attentional lapses have been related to failure of DMN deactivation in healthy human subjects [Weissman et al., 2006] and macaque monkeys [Hayden et al., 2009]. Similarly, in their study comparing adults with FASD to Ctls, Santhanam et al. [2011] reported that less DMN deactivation during a task was associated with poorer attentional modulation.
Salience and executive control have been characterized as overlapping but dissociable networks that regulate dynamic changes in other networks [Bonnelle et al., 2011; Seeley et al., 2007]. The dorsal anterior cingulate and orbitofrontal insula are often coactivated with the lateral prefrontal cortex and parietal lobe in tasks involving attention, working memory, and response selection. The same regions are also activated in response to pain, uncertainty, and threats to homeostasis; that is, events and experiences with a high degree of personal salience. The executive control network links the dorsolateral frontal and parietal neocortices, mediating tasks requiring focused attention and working memory, while the salience network is anchored by the dorsal anterior cingulate and orbitofrontal insula, with robust connectivity to subcortical and limbic structures, mediating response to pain, empathy for pain, hunger, pleasurable touch, and social rejection.
The dorsal frontoparietal attention network enables the selection of sensory stimuli based on internal goals or expectations (goal‐driven or endogenous attention) and links them to appropriate motor responses [Corbetta et al., 2008]. By contrast, the ventral frontoparietal network detects salient stimuli in the environment (stimulus‐driven attention), interrupting dorsal attention to reorient to new objects based on their high sensory salience and/or behavioral relevance.
The five resting‐state networks that were altered in the children with prenatal alcohol exposure relate to higher order cognitive control, affective regulation, and attention, whereas networks relating to more perceptually driven visual and somatosensory function do not appear to be affected. It is also of interest that alcohol exposure was associated with reduced functional connectivity in the anterior portion of the DMN, which has been implicated in social perception, judgment, and self‐referential processing, rather than the posterior portion, which mediates visuo‐spatial imagery and episodic memory [Uddin et al., 2009]. It is noteworthy that the findings of reduced connectivity in the executive control and attention networks are consistent with deficits in cognitive and attentional function that have been extensively documented in FASD [Mattson et al., 2011]. The reduced connectivity in the salience and anterior default mode networks is consistent with deficits in social information processing and social problem‐solving skills that have frequently been described in FASD by clinicians, teachers, and caregivers [Roebuck et al., 1999] but documented systematically in only a few recent studies [e.g., Greenbaum et al., 2009; McGee et al., 2009]. A recent study with the Cape Town Longitudinal Cohort found that the ability to accurately identify emotional facial expressions is particularly affected in FASD [Kilchenmann et al., 2012, Lindinger et al., 2016]. Our findings of reduced connectivity in salience and anterior DMN, two major networks that mediate social and affective information processing further underscore the need for additional FASD research in this domain.
In addition to PE, fALFF and ReHo were also used to quantify local RSFC properties. After controlling for potential confounders, increasing prenatal alcohol exposure was associated with reduced fALFF and ReHo in the regions where children with FAS/PFAS had reduced connectivity within the default mode, salience, and dorsal attention networks, indicating reductions both in the relative contribution of low‐frequency fluctuations to the BOLD signal and in synchronization between the time series of a given voxel and its nearest neighbors. The associations between altered connectivity and the continuous prenatal alcohol exposure measures suggest dose‐dependent impairments in these regions.
Among the control variables examined in this study, the strongest associations with the RSFC parameters were those for postnatal lead exposure with the dorsal and ventral attention networks. For the dorsal network the inclusion of lead in the linear regression model revealed a stronger association between AA/day and both fALFF and ReHo, indicating that the lead exposure tended to suppress or obscure the prenatal alcohol effects. However, for the ventral attention network the association of AA/day and fALFF was no longer significant after the inclusion of lead exposure. Nevertheless, when lead exposure was controlled for in the voxelwise group comparison of RSNs between children with FAS/PFAS and controls, a cluster with the same peak coordinate in the ventral attention network emerged from the analysis, and no new clusters were revealed (Appendix 3a and b), suggesting that the observed reduced connectivity in this region is due to PAE rather than postnatal lead exposure.
We also investigated whether the alterations in resting‐state functional connectivity may be attributable to WM deficits in tracts connecting regions within the affected RSNs. Our data suggest that the deficits in GM connectivity within the default mode, ventral attention, salience, and R executive control networks could be related to WM deficits in the R superior longitudinal fasciculus, R corticospinal tract and L middle cerebellar peduncle, which provide intra‐RSN connections. The default mode, ventral attention, and salience networks showed dose‐dependent effects, while the R executive control network did not. By contrast, increases in MD were not dose dependent in the WM tracts posited to be associated with reduced connectivity in the default mode, ventral attention, and salience networks, namely, the R superior longitudinal fasciculus and R corticospinal tract [Fan et al., 2016], but were dose dependent in the L middle peduncle [Fan et al., 2015], indicating that the interaction between WM alterations and functional connectivity is complex. A tractography‐based approach using GM regions with reduced connectivity as seeds could reveal fetal alcohol‐related microstructural deficits in specific WM tracts connecting affected regions on a subject‐by‐subject level.
One limitation of this study is that pediatric neuroimaging assessments are very sensitive to subject motion and related imaging artifacts. Here, all rs‐fMRI data were visually checked during processing and aligned to standard space. Registration parameters were screened as well to exclude subjects with excessive motion. Despite these precautions, factors such as acquisition artifacts, scanner noise, and minor differences in warping could still affect the results.
Two of the regions showing reduced connectivity in children with FAS/PFAS here, namely the R postcentral and precentral gyri, are not conventionally included in the anterior default mode and ventral attention networks, respectively. However, most rs‐fMRI studies have been conducted in adults, and limited data are available in children. The R precentral gyrus has been shown to exhibit increased functional connectivity to a seed in the dorsal attention network in children compared to adults [Farrant and Uddin, 2015], and significant connectivity has previously been reported between R postcentral gyrus and a seed in the DMN in at least one study with adults [Uddin et al., 2009]. Localized connectivity increases or decreases in children compared to adults [Farrant and Uddin, 2015] may alter independent component splitting [de Bie et al., 2012], resulting in additional regions being included in networks.
One potential limitation of our analysis linking our findings regarding the effects of prenatal alcohol exposure on intranetwork functional connectivity to increases in MD observed in two separate but overlapping samples is the fact that only about 20 children overlapped between this rs‐fMRI and each of the two previous DTI studies. However, given that RSFC and MD did not differ between the overlapping and nonoverlapping children in either the control or FAS/PFAS groups in either of the data sets (all Ps > 0.3), we do not believe that the functional connectivity reductions and MD increases on which our conclusions about potential structural–functional associations are based were driven primarily by the nonoverlapping group of subjects.
Although the four cortical regions showing connectivity differences here were all located superiorly, clusters were well localized within network masks and met strict cluster size criteria for significance. The locations of these regions suggest that networks in children with prenatal alcohol exposure may be less extensive than in control children. Three of the four cortical regions were also on the right side of the brain, and the cerebellar region on the left. Although this may be related to the handedness of the children, differences in lateralization for different functional domains have been reported previously [Gotts et al., 2013], with left hemisphere regions involved in left‐lateralized functions showing a preference to interact with regions in the left hemisphere, compared to right hemisphere regions that interact more strongly with both hemispheres. Further studies are needed to investigate effects of prenatal alcohol exposure on functional lateralization.
CONCLUSIONS
This is the first study to use group ICA to evaluate the effect of prenatal alcohol exposure on multiple RSNs in FASD. The voxelwise group comparisons showed lower RSFC in five regions within five networks—anterior DMN, salience, ventral attention, dorsal attention, and R executive control—in children with FAS/PFAS compared to nonexposed or minimally exposed Ctls, three of which were also observed in nonsyndromal HE children. It is noteworthy that the resting‐state networks altered in FASD relate to higher order cognitive control, affective regulation, and attention, whereas networks relating to more perceptually driven visual and somatosensory function did not appear to be affected. The findings of reduced connectivity in the attention and executive control networks are consistent with deficits in cognitive function that have been extensively documented in FASD. The reduced connectivity in salience and anterior DMN, two major networks that mediate social and affective information processing, underscore the need for additional FASD research in this relatively understudied domain. Visual inspection of the spatial locations of functional and structural connectivity group differences seen in this cohort suggest that the deficits in RSFC within the default mode, ventral attention, salience and R executive control networks could be related to WM deficits in specific tracts that provide intra‐RSN connections.
ACKNOWLEDGMENTS
The authors thank the CUBIC radiographers Marie‐Louise de Villiers and Nailah Maroof, and our UCT and WSU research staff Nicolette Hamman, Mariska Pienaar, Maggie September, Emma Makin, and Renee Sun; the three dysmorphologists H.E. Hoyme, L.K. Robinson, and N. Khaole, who performed the dysmorphology examinations of the children in conjunction with the NIAAA Collaborative Initiative on Fetal Alcohol Spectrum Disorders. We also appreciate the contributions of the mothers and children who have participated in our Cape Town Longitudinal Cohort research.
APPENDIX 1. A COMPACT TCSH SCRIPT TO USE AFNI'S AFNI_PROC.PY COMMAND TO GENERATE THE FULL FMRI PROCESSING PIPELINE
#!/bin/tcsh
set here = $PWD
set namelist = ‘ls ‐d *’
foreach pref ($namelist)
cd $here/$pref
# input data sets
set rest_set = “${pref}_rest.nii.gz”
set anat_set = “${pref}_T1.nii.gz”
# output file prefix
set sub_name = “${pref}_proc”
# make processing script
afni_proc.py\
‐subj_id ${sub_name}\
‐dsets ${rest_set}\
‐copy_anat ${anat_set}\
‐blocks despike tshift align tlrc volreg blur mask regress\
‐anat_has_skull no\
‐tcat_remove_first_trs 4\
‐align_opts_aea ‐cost lpc + ZZ ‐giant_move\
‐volreg_align_e2a\
‐volreg_tlrc_warp\
‐tlrc_NL_warp\
‐blur_size 6.0\
‐mask_apply epi\
‐mask_segment_anat yes\
‐regress_bandpass 0.01 0.1\
‐regress_apply_mot_types demean deriv\
‐regress_ROI WMe CSFe\
‐regress_RSFC\
‐regress_run_clustsim no\
‐regress_est_blur_errts
# execute processing script
tcsh ‐xef proc.${sub_name} |& tee output.proc.${sub_name}
# convert filtered time series to nifti files
cd “$sub_name”.results
3dcopy RSFC_LFF_rall_$sub_name + tlrc. RSFC_LFF_rall_$sub_name.nii.gz
end
APPENDIX 2. CLUSTER SIZE THRESHOLDS FOR INDIVIDUAL NETWORKS AT P = 0.001 and alpha = 0.05 CALCULATED USING 3DCLUSTSIM
| DMN | Salience | Ventral attention | Dorsal attention | R executive control | |
|---|---|---|---|---|---|
| Size (mm3) | 297 | 324 | 243 | 297 | 324 |
APPENDIX 3. SIZE AND PEAK COORDINATES (IN TT STANDARD SPACE) OF REGIONS IN FIVE DIFFERENT RESTING‐STATE NETWORKS SHOWING REDUCED CONNECTIVITY WHEN VOXELWISE GROUP COMPARISONS WERE REPEATED WITH EACH CONTROL VARIABLE ADDED SEPARATELY FOR (a) FAS/PFAS CHILDREN COMPARED TO CONTROLS AND (b) HEAVY EXPOSED NONSYNDROMAL (HE) CHILDREN COMPARED TO CONTROLS
| (a) FAS/PFAS children versus controls | ||||
|---|---|---|---|---|
| Predictor | Size (mm3) | Peak coordinates | ||
| x | y | z | ||
| DMN | ||||
| None | 540 | 46.5 | −31.5 | 44.5 |
| Child's sex | 351 | 46.5 | −31.5 | 44.5 |
| Child's age at scan | 432 | 46.5 | −28.5 | 44.5 |
| Lead exposure | 324 | 46.5 | −31.5 | 47.5 |
| Maximum translation | 432 | 46.5 | −31.5 | 44.5 |
| Total gray matter volume | 459 | 46.5 | −31.5 | 44.5 |
| Maternal age | 486 | 46.5 | −31.5 | 44.5 |
| Maternal education | 324 | 46.5 | −31.5 | 44.5 |
| Smoking during pregnancy | 324 | 46.5 | −31.5 | 44.5 |
| Salience | ||||
| None | 351 | 10.5 | −1.5 | 59.5 |
| Child's sex | 297 | 10.5 | 1.5 | 56.5 |
| Child's age at scan | 459 | 10.5 | −1.5 | 56.5 |
| Lead exposure | 567 | 10.5 | 1.5 | 56.5 |
| Maximum translation | 378 | 10.5 | −1.5 | 59.5 |
| Total gray matter volume | 405 | 10.5 | −1.5 | 59.5 |
| Maternal age | 378 | 10.5 | −1.5 | 56.5 |
| Maternal education | 297 | 10.5 | −1.5 | 59.5 |
| Smoking during pregnancy | 297 | 10.5 | −1.5 | 59.5 |
| Ventral attention | ||||
| None | 729 | 43.5 | 1.5 | 44.5 |
| Child's sex | 378 | 46.5 | −1.5 | 47.5 |
| Child's age at scan | 378 | 43.5 | −1.5 | 47.5 |
| Lead exposure | 351 | 46.5 | 1.5 | 44.5 |
| Maximum translation | 378 | 43.5 | 1.5 | 44.5 |
| Total gray matter volume | 540 | 43.5 | 1.5 | 47.5 |
| Maternal age | 459 | 43.5 | −1.5 | 44.5 |
| Maternal education | 378 | 46.5 | −1.5 | 47.5 |
| Smoking during pregnancy | 594 | 43.5 | −1.5 | 44.5 |
| Dorsal attention | ||||
| None | 486 | −31.5 | −7.5 | 53.5 |
| Child's sex | 486 | −31.5 | −10.5 | 53.5 |
| Child's age at scan | 621 | −28.5 | −10.5 | 53.5 |
| Lead exposure | 486 | −31.5 | −7.5 | 53.5 |
| Maximum translation | 594 | −31.5 | −7.5 | 53.5 |
| Total gray matter volume | 513 | −31.5 | −10.5 | 53.5 |
| Maternal age | 324 | −31.5 | −7.5 | 50.5 |
| Maternal education | 594 | −31.5 | −7.5 | 53.5 |
| Smoking during pregnancy | 783 | −28.5 | −7.5 | 50.5 |
| Right executive control | ||||
| None | 675 | −10.5 | −73.5 | −30.5 |
| Child's sex | 378 | −10.5 | −76.5 | −30.5 |
| Child's age at scan | 351 | −13.5 | −73.5 | −30.5 |
| Lead exposure | 351 | −10.5 | −76.5 | −30.5 |
| Maximum translation | 378 | −10.5 | −73.5 | −30.5 |
| Total gray matter volume | 567 | −10.5 | −73.5 | −30.5 |
| Maternal age | 378 | −10.5 | −73.5 | −30.5 |
| Maternal education | 567 | −13.5 | −76.5 | −30.5 |
| Smoking during pregnancy | 567 | −10.5 | −76.5 | −30.5 |
| (b) HE children versus controls | ||||
|---|---|---|---|---|
| Predictor | Size (mm3) | Peak coordinates | ||
| x | y | z | ||
| DMN | ||||
| None | 405 | 52.5 | −28.5 | 38.5 |
| Child's sex | 405 | 52.5 | −28.5 | 38.5 |
| Child's age at scan | 459 | 52.5 | −28.5 | 38.5 |
| Lead exposure | 432 | 52.5 | −28.5 | 38.5 |
| Maximum translation | 405 | 52.5 | −28.5 | 38.5 |
| Total gray matter volume | 432 | 52.5 | −28.5 | 38.5 |
| Maternal age | 324 | 52.5 | −28.5 | 38.5 |
| Maternal education | 351 | 52.5 | −28.5 | 38.5 |
| Smoking during pregnancy | 378 | 52.5 | −28.5 | 38.5 |
| Salience | ||||
| None | 891 | 7.5 | 1.5 | 53.5 |
| Child's sex | 756 | 10.5 | −1.5 | 53.5 |
| Child's age at scan | 756 | 10.5 | −1.5 | 53.5 |
| Lead exposure | 702 | 10.5 | −1.5 | 53.5 |
| Maximum translation | 702 | 7.5 | 1.5 | 53.5 |
| Total gray matter volume | 837 | 10.5 | −1.5 | 53.5 |
| Maternal age | 891 | 10.5 | −1.5 | 53.5 |
| Maternal education | 837 | 10.5 | 1.5 | 53.5 |
| Smoking during pregnancy | 891 | 10.5 | −1.5 | 53.5 |
| Ventral attention | ||||
| None | 513 | 40.5 | −7.5 | 44.5 |
| Child's sex | 432 | 40.5 | −7.5 | 44.5 |
| Child's age at scan | 324 | 43.5 | −1.5 | 47.5 |
| Lead exposure | 405 | 40.5 | −7.5 | 44.5 |
| Maximum translation | 432 | 40.5 | −7.5 | 44.5 |
| Total gray matter volume | 432 | 40.5 | −7.5 | 44.5 |
| Maternal age | 405 | 40.5 | −7.5 | 44.5 |
| Maternal education | 486 | 40.5 | −7.5 | 44.5 |
| Smoking during pregnancy | 405 | 40.5 | −7.5 | 44.5 |
Contributor Information
Jia Fan, Email: jia.fan@uct.ac.za.
Sandra W. Jacobson, Email: sandra.jacobson@wayne.edu.
REFERENCES
- Andersson JL, Skare S, Ashburner J (2003): How to correct susceptibility distortions in spin‐echo echo‐planar images: Application to diffusion tensor imaging. NeuroImage 20:870–888. [DOI] [PubMed] [Google Scholar]
- Annett M (1970): A classification of hand preference by association analysis. Br J Psychol 61:303–321. [DOI] [PubMed] [Google Scholar]
- Beckmann CF, DeLuca M, Devlin JT, Smith SM (2005): Investigations into resting‐state connectivity using independent component analysis. Philos Trans R Soc Lond B Biol Sci 360:1001–1013. [DOI] [PMC free article] [PubMed] [Google Scholar]
- Beckmann CF, Mackay CE, Filippini N, Smith SM (2009): Group comparison of resting‐state FMRI data using multi‐subject ICA and dual regression. NeuroImage 47:S148. [Google Scholar]
- Beckmann CF, Smith SM (2004): Probabilistic independent component analysis for functional magnetic resonance imaging. IEEE Trans Med Imag 23:137–152. [DOI] [PubMed] [Google Scholar]
- Bernard JA, Mittal VA (2014): Dysfunctional activation of the cerebellum in schizophrenia: A functional neuroimaging meta‐analysis. Clin Psychol Sci 2167702614542463. [DOI] [PMC free article] [PubMed] [Google Scholar]
- Binder JR, Frost JA, Hammeke TA, Bellgowan P, Rao SM, Cox RW (1999): Conceptual processing during the conscious resting state: A functional MRI study. J Cogn Neurosci 11:80–93. [DOI] [PubMed] [Google Scholar]
- Biswal B, Yetkin FZ, Haughton VM, Hyde JS (1995): Functional connectivity in the motor cortex of resting human brain using echo‐planar MRI. Magn Reson Med 34:537–541. [DOI] [PubMed] [Google Scholar]
- Biswal BB, Mennes M, Zuo X‐N, Gohel S, Kelly C, Smith SM, Beckmann CF, Adelstein JS, Buckner RL, Colcombe S (2010): Toward discovery science of human brain function. Proc Natl Acad Sci 107:4734–4739. [DOI] [PMC free article] [PubMed] [Google Scholar]
- Boly M, Phillips C, Tshibanda L, Vanhaudenhuyse A, Schabus M, Dang‐Vu TT, Moonen G, Hustinx R, Maquet P, Laureys S (2008): Intrinsic brain activity in altered states of consciousness. Ann N Y Acad Sci 1129:119–129. [DOI] [PMC free article] [PubMed] [Google Scholar]
- Bonnelle V, Leech R, Kinnunen KM, Ham TE, Beckmann CF, De Boissezon X, Greenwood RJ, Sharp DJ (2011): Default mode network connectivity predicts sustained attention deficits after traumatic brain injury. J Neurosci 31:13442–13451. [DOI] [PMC free article] [PubMed] [Google Scholar]
- Buckner RL, Andrews‐Hanna JR, Schacter DL (2008): The brain's default network. Ann N Y Acad Sci 1124:1–38. [DOI] [PubMed] [Google Scholar]
- Coles CD, Platzman KA, Raskind‐Hood CL, Brown RT, Falek A, Smith IE (1997): A comparison of children affected by prenatal alcohol exposure and attention deficit, hyperactivity disorder. Alcohol Clin Exp Res 21:150–161. [PubMed] [Google Scholar]
- Corbetta M, Patel G, Shulman GL (2008): The reorienting system of the human brain: From environment to theory of mind. Neuron 58:306–324. [DOI] [PMC free article] [PubMed] [Google Scholar]
- Cox RW (1996): AFNI: Software for analysis and visualization of functional magnetic resonance neuroimages. Comput Biomed Res 29:162–173. [DOI] [PubMed] [Google Scholar]
- Cox RW, Chen G, Glen DR, Reynolds RC, Taylor PA (2017): FMRI clustering in AFNI: False positive rates redux. Brain Connect (in press). [DOI] [PMC free article] [PubMed] [Google Scholar]
- Damoiseaux J, Rombouts S, Barkhof F, Scheltens P, Stam C, Smith SM, Beckmann C (2006): Consistent resting‐state networks across healthy subjects. Proc Natl Acad Sci 103:13848–13853. [DOI] [PMC free article] [PubMed] [Google Scholar]
- de Bie H, Boersma M, Adriaanse S, Veltman DJ, Wink AM, Roosendaal SD, Barkhof F, Stam CJ, Oostrom KJ, Delemarre‐van de Waal HA (2012): Resting‐state networks in awake five‐to eight‐year old children. Hum Brain Mapp 33:1189–1201. [DOI] [PMC free article] [PubMed] [Google Scholar]
- Dodge NC, Jacobson JL, Jacobson SW (2014): Protective effects of the alcohol dehydrogenase‐ADH1B* 3 allele on attention and behavior problems in adolescents exposed to alcohol during pregnancy. Neurotoxicol Teratol 41:43–50. [DOI] [PMC free article] [PubMed] [Google Scholar]
- du Plessis L, Jacobson JL, Jacobson SW, Hess AT, Kouwe A, Avison MJ, Molteno CD, Stanton ME, Stanley JA, Peterson BS, Meintjes EM (2014): An in vivo 1H magnetic resonance spectroscopy study of the deep cerebellar nuclei in children with fetal alcohol spectrum disorders. Alcohol Clin Exp Res 38:1330–1338. [DOI] [PMC free article] [PubMed] [Google Scholar]
- Fair DA, Dosenbach NU, Church JA, Cohen AL, Brahmbhatt S, Miezin FM, Barch DM, Raichle ME, Petersen SE, Schlaggar BL (2007): Development of distinct control networks through segregation and integration. Proc Natl Acad Sci 104:13507–13512. 17679691 [Google Scholar]
- Fan J, Meintjes EM, Molteno CD, Spottiswoode BS, Dodge NC, Alhamud AA, Stanton ME, Peterson BS, Jacobson JL, Jacobson SW (2015): White matter integrity of the cerebellar peduncles as a mediator of effects of prenatal alcohol exposure on eyeblink conditioning. Hum Brain Mapp 36:2470–2482. [DOI] [PMC free article] [PubMed] [Google Scholar]
- Fan J, Jacobson SW, Taylor PA, Molteno CD, Dodge NC, Stanton ME, Jacobson JL, Meintjes EM (2016): White matter deficits mediate effects of prenatal alcohol exposure on cognitive development in childhood. Hum Brain Mapp 37:2943–2958. [DOI] [PMC free article] [PubMed] [Google Scholar]
- Farrant K, Uddin LQ (2015): Asymmetric development of dorsal and ventral attention networks in the human brain. Dev Cogn Neurosci 12:165–174. [DOI] [PMC free article] [PubMed] [Google Scholar]
- Fransson P, Skiöld B, Horsch S, Nordell A, Blennow M, Lagercrantz H, Åden U (2007): Resting‐state networks in the infant brain. Proc Natl Acad Sci 104:15531–15536. [DOI] [PMC free article] [PubMed] [Google Scholar]
- Fryer SL, Tapert SF, Mattson SN, Paulus MP, Spadoni AD, Riley EP (2007): Prenatal alcohol exposure affects frontal–striatal BOLD response during inhibitory control. Alcohol Clin Exp Res 31:1415–1424. [DOI] [PubMed] [Google Scholar]
- Gotts SJ, Jo HJ, Wallace GL, Saad ZS, Cox RW, Martin A (2013): Two distinct forms of functional lateralization in the human brain. Proc Natl Acad Sci 110:3435–3444. [DOI] [PMC free article] [PubMed] [Google Scholar]
- Greenbaum RL, Stevens SA, Nash K, Koren G, Rovet J (2009): Social cognitive and emotion processing abilities of children with fetal alcohol spectrum disorders: A comparison with attention deficit hyperactivity disorder. Alcohol Clin Exp Res 33:1656–1670. [DOI] [PubMed] [Google Scholar]
- Greicius MD, Kiviniemi V, Tervonen O, Vainionpää V, Alahuhta S, Reiss AL, Menon V (2008): Persistent default‐mode network connectivity during light sedation. Hum Brain Mapp 29:839–847. [DOI] [PMC free article] [PubMed] [Google Scholar]
- Habas C, Kamdar N, Nguyen D, Prater K, Beckmann CF, Menon V, Greicius MD (2009): Distinct cerebellar contributions to intrinsic connectivity networks. J Neurosci 29:8586–8594. [DOI] [PMC free article] [PubMed] [Google Scholar]
- Hayden BY, Smith DV, Platt ML (2009): Electrophysiological correlates of default‐mode processing in macaque posterior cingulate cortex. Proc Natl Acad Sci 106:5948–5953. [DOI] [PMC free article] [PubMed] [Google Scholar]
- Hoyme HE, May PA, Kalberg WO, Kodituwakku P, Gossage JP, Trujillo PM, Buckley DG, Miller JH, Aragon AS, Khaole N (2005): A practical clinical approach to diagnosis of fetal alcohol spectrum disorders: Clarification of the 1996 institute of medicine criteria. Pediatrics 115:39–47. [DOI] [PMC free article] [PubMed] [Google Scholar]
- Jacobson SW, Chiodo LM, Sokol RJ, Jacobson JL (2002): Validity of maternal report of alcohol, cocaine, and smoking during pregnancy in relation to infant neurobehavioral outcome. Pediatrics 109:815–825. [DOI] [PubMed] [Google Scholar]
- Jacobson SW, Jacobson JL, Sokol RJ, Chiodo LM, Corobana R (2004): Maternal age, alcohol abuse history, and quality of parenting as moderators of the effects of prenatal alcohol exposure on 7.5‐year intellectual function. Alcohol Clin Exp Res 28:1732–1745. [DOI] [PubMed] [Google Scholar]
- Jacobson SW, Stanton ME, Molteno CD, Burden MJ, Fuller DS, Hoyme HE, Robinson LK, Khaole N, Jacobson JL (2008): Impaired eyeblink conditioning in children with fetal alcohol syndrome. Alcohol Clin Exp Res 32:365–372. [DOI] [PubMed] [Google Scholar]
- Kalberg WO, Provost B, Tollison SJ, Tabachnick BG, Robinson LK, Eugene Hoyme H, Trujillo PM, Buckley D, Aragon AS, May PA (2006): Comparison of motor delays in young children with fetal alcohol syndrome to those with prenatal alcohol exposure and with no prenatal alcohol exposure. Alcohol Clin Exp Res 30:2037–2045. [DOI] [PubMed] [Google Scholar]
- Kilchenmann N, Thomas K, Molteno C, Dodge N, Meintjes E, Jacobson J, Jacobson S (2012): Fetal alcohol spectrum disorders and theory of mind: An exploratory study of South African children. Alcohol Clin Exp Res 36:205A. [Google Scholar]
- Lindinger NM, Malcolm‐Smith S, Dodge NC, Molteno CD, Kevin GF, Thomas KGF, Meintjes EM, Jacobson JL, Jacobson SW (2016): Theory of mind in children with fetal alcohol spectrum disorders. Alcohol Clin Exp Res 40:367–376. [DOI] [PMC free article] [PubMed] [Google Scholar]
- Mattson SN, Crocker N, Nguyen TT (2011): Fetal alcohol spectrum disorders: Neuropsychological and behavioral features. Neuropsychol Rev 21:81–101. [DOI] [PMC free article] [PubMed] [Google Scholar]
- McGee CL, Bjorkquist OA, Riley EP, Mattson SN (2009): Impaired language performance in young children with heavy prenatal alcohol exposure. Neurotoxicol Teratol 31:71–75. [DOI] [PMC free article] [PubMed] [Google Scholar]
- Oldfield RC (1971): The assessment and analysis of handedness: The Edinburgh inventory. Neuropsychologia 9:97–113. [DOI] [PubMed] [Google Scholar]
- Raichle ME, MacLeod AM, Snyder AZ, Powers WJ, Gusnard DA, Shulman GL (2001): A default mode of brain function. Proc Natl Acad Sci 98:676–682. [DOI] [PMC free article] [PubMed] [Google Scholar]
- Robertson FC, Narr KL, Molteno CD, Jacobson JL, Jacobson SW, Meintjes EM (2015): Prenatal alcohol exposure is associated with regionally thinner cortex during the preadolescent period. Cereb Cortex bhv131. [DOI] [PMC free article] [PubMed] [Google Scholar]
- Roebuck TM, Mattson SN, Riley EP (1999): Behavioral and psychosocial profiles of alcohol‐exposed children. Alcohol Clin Exp Res 23:1070–1076. [PubMed] [Google Scholar]
- Rosazza C, Minati L (2011): Resting‐state brain networks: Literature review and clinical applications. Neurol Sci 32:773–785. [DOI] [PubMed] [Google Scholar]
- Santhanam P, Coles CD, Li Z, Li L, Lynch ME, Hu X (2011): Default mode network dysfunction in adults with prenatal alcohol exposure. Psychiatry Res Neuroimag 194:354–362. [DOI] [PMC free article] [PubMed] [Google Scholar]
- Seeley WW, Menon V, Schatzberg AF, Keller J, Glover GH, Kenna H, Reiss AL, Greicius MD (2007): Dissociable intrinsic connectivity networks for salience processing and executive control. J Neurosci 27:2349–2356. [DOI] [PMC free article] [PubMed] [Google Scholar]
- Shulman GL, Fiez JA, Corbetta M, Buckner RL, Miezin FM, Raichle ME, Petersen SE (1997): Common blood flow changes across visual tasks: II. Decreases in cerebral cortex. J Cogn Neurosci 9:648–663. [DOI] [PubMed] [Google Scholar]
- Smith SM, Fox PT, Miller KL, Glahn DC, Fox PM, Mackay CE, Filippini N, Watkins KE, Toro R, Laird AR (2009): Correspondence of the brain's functional architecture during activation and rest. Proc Natl Acad Sci 106:13040–13045. [DOI] [PMC free article] [PubMed] [Google Scholar]
- Smith SM, Jenkinson M, Woolrich MW, Beckmann CF, Behrens TE, Johansen‐Berg H, Bannister PR, De Luca M, Drobnjak I, Flitney DE (2004): Advances in functional and structural MR image analysis and implementation as FSL. NeuroImage 23:208–219. [DOI] [PubMed] [Google Scholar]
- Stevens MC, Pearlson GD, Calhoun VD (2009): Changes in the interaction of resting‐state neural networks from adolescence to adulthood. Hum Brain Mapp 30:2356–2366. [DOI] [PMC free article] [PubMed] [Google Scholar]
- Streissguth AP, Barr HM, Sampson PD, Bookstein FL (1994): Prenatal alcohol and offspring development: The first fourteen years. Drug Alcohol Depend 36:89–99. [DOI] [PubMed] [Google Scholar]
- Supekar K, Musen M, Menon V (2009): Development of large‐scale functional brain networks in children. PLoS Biol 7:1521. [DOI] [PMC free article] [PubMed] [Google Scholar]
- Taylor PA, Saad ZS (2013): FATCAT:(an efficient) Functional and tractographic connectivity analysis toolbox. Brain Connect 3:523–535. [DOI] [PMC free article] [PubMed] [Google Scholar]
- Tisdall M, Hess A, Van der Kouwe A (2009): MPRAGE using EPI navigators for prospective motion correction. ISMRM. [Google Scholar]
- Uddin LQ, Clare Kelly A, Biswal BB, Xavier Castellanos F, Milham MP (2009): Functional connectivity of default mode network components: Correlation, anticorrelation, and causality. Hum Brain Mapp 30:625–637. [DOI] [PMC free article] [PubMed] [Google Scholar]
- van der Kouwe AJ, Benner T, Salat DH, Fischl B (2008): Brain morphometry with multiecho MPRAGE. NeuroImage 40:559–569. [DOI] [PMC free article] [PubMed] [Google Scholar]
- Vincent J, Patel G, Fox M, Snyder A, Baker J, Van Essen D, Zempel J, Snyder L, Corbetta M, Raichle M (2007): Intrinsic functional architecture in the anaesthetized monkey brain. Nature 447:83–86. [DOI] [PubMed] [Google Scholar]
- Weissman D, Roberts K, Visscher K, Woldorff M (2006): The neural bases of momentary lapses in attention. Nat Neurosci 9:971–978. [DOI] [PubMed] [Google Scholar]
- Winer BJ, Brown DR, Michels KM (1971): Statistical Principles in Experimental Design. New York: McGraw‐Hill. [Google Scholar]
- Wozniak JR, Mueller BA, Bell CJ, Muetzel RL, Hoecker HL, Boys CJ, Lim KO (2013): Global functional connectivity abnormalities in children with fetal alcohol spectrum disorders. Alcohol Clin Exp Res 37:748–756. [DOI] [PMC free article] [PubMed] [Google Scholar]
- Wozniak JR, Mueller BA, Muetzel RL, Bell CJ, Hoecker HL, Nelson ML, Chang PN, Lim KO (2011): Inter‐hemispheric functional connectivity disruption in children with prenatal alcohol exposure. Alcohol Clin Exp Res 35:849–861. [DOI] [PMC free article] [PubMed] [Google Scholar]
- Zang Y, Jiang T, Lu Y, He Y, Tian L (2004): Regional homogeneity approach to fMRI data analysis. NeuroImage 22:394–400. [DOI] [PubMed] [Google Scholar]
- Zang Y, He Y, Zhu C, Cao Q, Sui M, Liang M, Tian L, Jiang T, Wang Y (2007): Altered baseline brain activity in children with ADHD revealed by resting‐state functional MRI. Brain Dev 29:83–91. [DOI] [PubMed] [Google Scholar]
- Zhou D, Lebel C, Lepage C, Rasmussen C, Evans A, Wyper K, Pei J, Andrew G, Massey A, Massey D (2011): Developmental cortical thinning in fetal alcohol spectrum disorders. NeuroImage 58:16–25. [DOI] [PubMed] [Google Scholar]
- Zou Q, Zhu C, Yang Y, Zuo X, Long X, Cao Q, Wang Y, Zang Y (2008): An improved approach to detection of amplitude of low‐frequency fluctuation (ALFF) for resting‐state fMRI: Fractional ALFF. J Neurosci Methods 172:137–141. [DOI] [PMC free article] [PubMed] [Google Scholar]