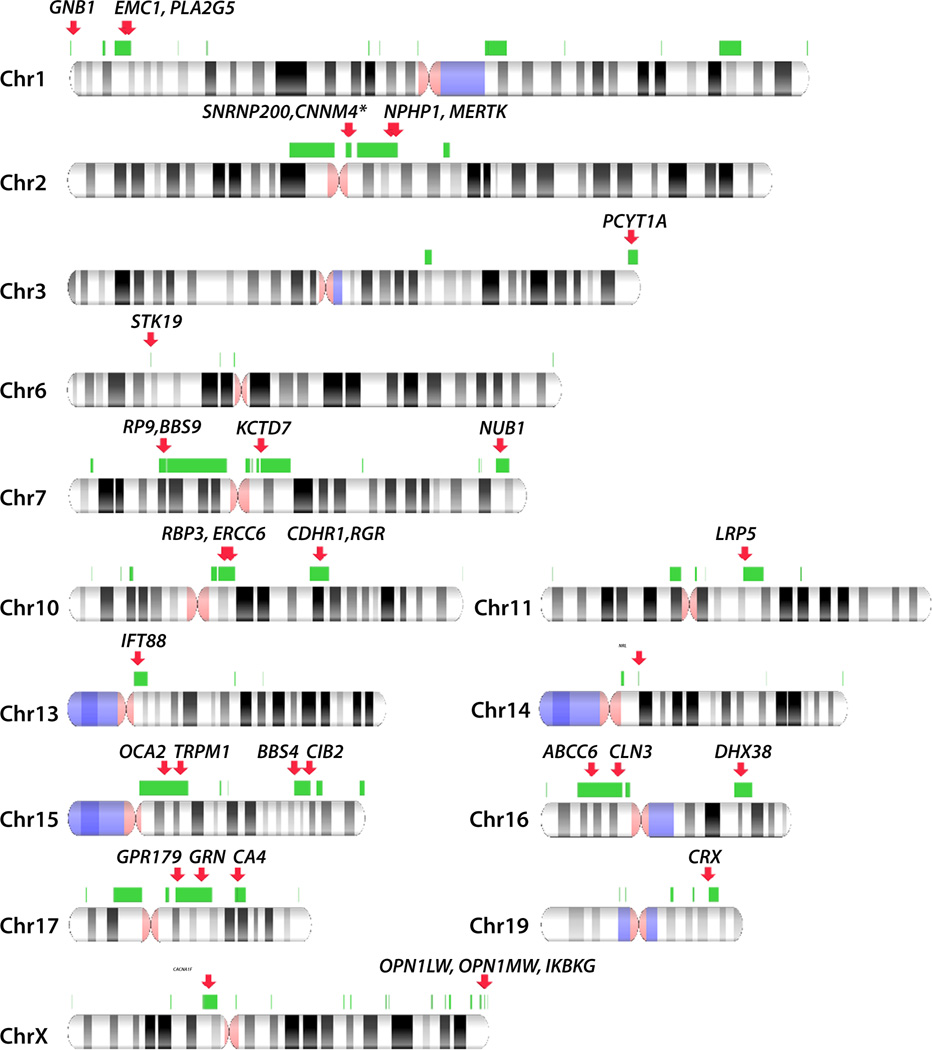
Figure 4. Non-allelic homologous recombination prone regions and IRD genes.
NAHR-prone regions (green bars) were computationally predicted using the following criteria: >10kb long regions of >95% identity, with intervening sequence between 50 kb and 10 Mb and not spanning the centromere. Direct and inverted repeats are included. IRD genes overlapping the NAHR-prone regions are indicated as red arrows. Only the chromosomes, where NAHR-prone regions and IRD genes overlap are presented. The full genome-wide map of NAHR-prone regions is presented in Table S2. The asterisk denotes IRD whole-gene CNVs reported in this manuscript for the first time.

