Figure 2.

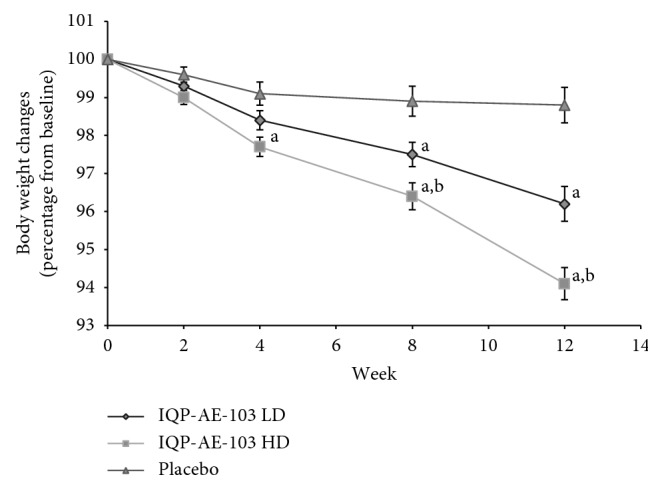
Mean body weight over time in percentage relative to baseline weight. LD = low dose; HD = high dose. Error bars denote standard error of mean. (a) significant vs. placebo and (b) significant vs. IQP-AE-103 LD.

Mean body weight over time in percentage relative to baseline weight. LD = low dose; HD = high dose. Error bars denote standard error of mean. (a) significant vs. placebo and (b) significant vs. IQP-AE-103 LD.