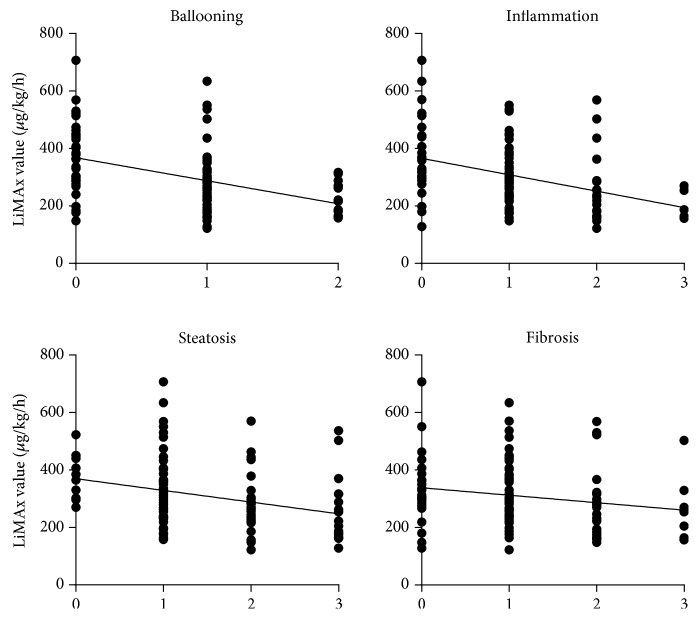
Figure 4.
Correlation between different histological features and LiMAx value. Correlations between LiMAx and different histological features were r = −0.446 for hepatocellular ballooning (p < 0.001), r = −0.397 for inflammation (p < 0.001), and r = −0.305 for steatosis (p = 0.002). No correlation was observed between the stage of fibrosis and liver function capacity (r = −0.195; p = 0.050).

