Figure 5.

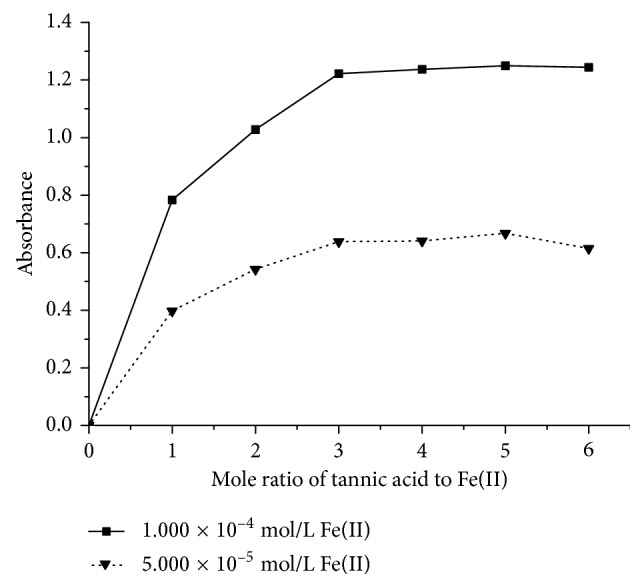
The mole ratio curves of the tannic acid-Fe(II) complex by the mole ratio method. The solid line denotes 1.000 × 10⁻⁴ mol/L Fe(II) in sample liquid. The dotted line denotes 5.000 × 10⁻⁵ mol/L Fe(II) in sample liquid.

The mole ratio curves of the tannic acid-Fe(II) complex by the mole ratio method. The solid line denotes 1.000 × 10⁻⁴ mol/L Fe(II) in sample liquid. The dotted line denotes 5.000 × 10⁻⁵ mol/L Fe(II) in sample liquid.