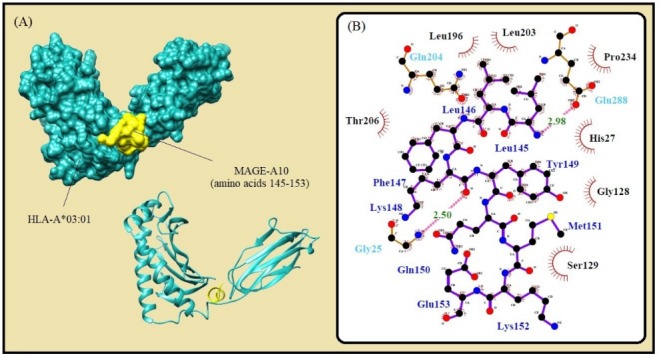
Fig. 3.

Molecular docking of the lowest E-total value fragment of MAGE-A10 (amino acids 145-153) with the HLA-A*01:01 active site. A) The surface and cartoon representation of the complexes HLA-A*01:01 (sky blue) and MAGE-A10 (yellow) visualised by UCSF Chimera software. B) The interactions between the vaccine peptide and the MHC allele prepared by Ligplot+ software. The pink dotted lines show hydrogen bonds and the red spline curves indicate hydrophobic contacts.
