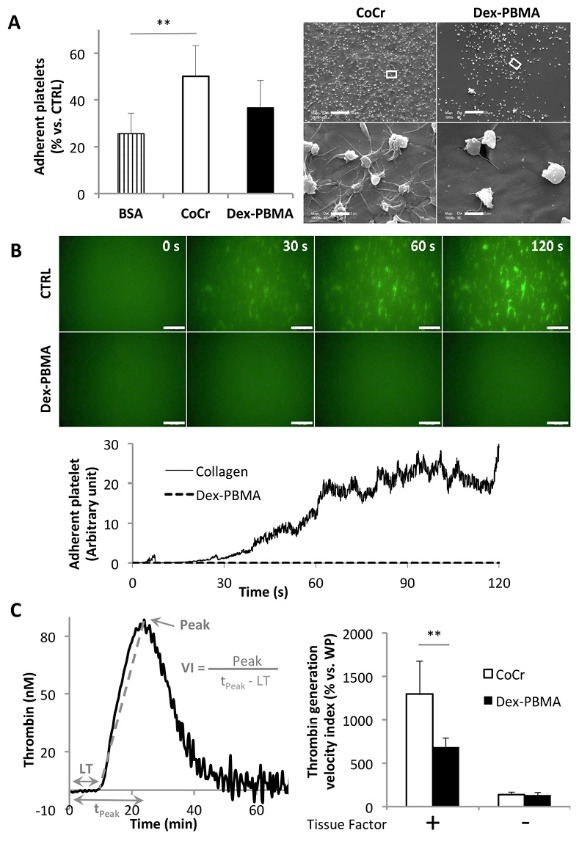
Fig. 3.

Human platelet adhesion and thrombin generation onto Dex-PBMA . (A) Left panel: Platelet adhesion in static condition on Dex-PBMA or CoCr discs and bovine serum albumin (BSA, negative control). Quantification of adherent platelets after 2h incubation at room temperature. Data are expressed as a percentage of adherent platelets on collagen (positive control). Values are mean ± SEM of three determinations. **P<0.01. Right panel: Environmental scanning electron micrographs of adherent platelets on Dex-PBMA and CoCr. Scale bar 20 μm, higher magnification scale bar 2 μm. (B) Up: Dynamic adhesion of dioc-6 labeled platelets on Dex-PBMA and collagen coated glass-coverslips submitted to physiological flow (shear rate 1500 s-1). Micrographs of adherent platelets after 0, 30, 60 and 120 s. Down: Quantification of the adhesion within times on Dex-PBMA and collagen. (C) Thrombin generation on Dex-PBMA and CoCr discs. Left panel: Representative curve obtained after a thrombin generation experiment. Parameters of thrombin generation are shown: Lagtime (LT in min), time to peak (tPeak in min) and Peak (nM). Right panel: Velocity Indexes (VI=Peak/(tPeak-LT) for thrombin generation in PPP in the absence or presence of TF (1 pM) on Dex-PBMA and CoCr. Data are expressed as a percentage of the results on well plate (WP). Values are mean ± SEM of six determinations. **P<0.01.
