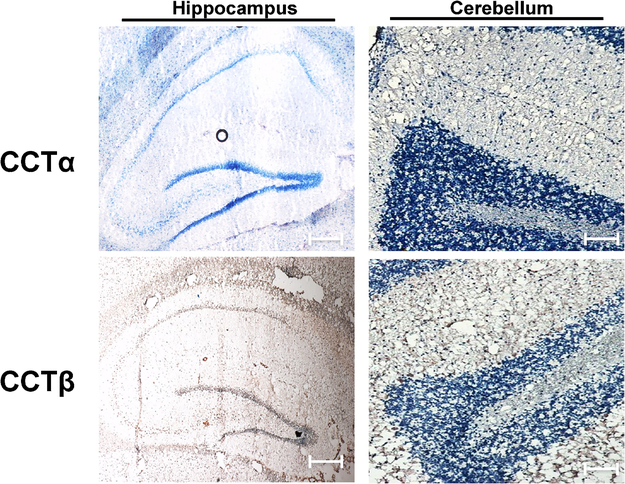
Figure 1. Distribution of CCT isoforms throughout the rat brain.
Immunohistochemical analysis of 10-μm sagittal sections (magnification: X20) demonstrated detection of CCTβ but not CCTα, in both the hippocampus and cerebellum where positive staining is indicated by DAB (brown). Scale bar, 50 μm. Images are representative of sections analyzed from at least 3 (n = 3) animals.

