Figure 1.

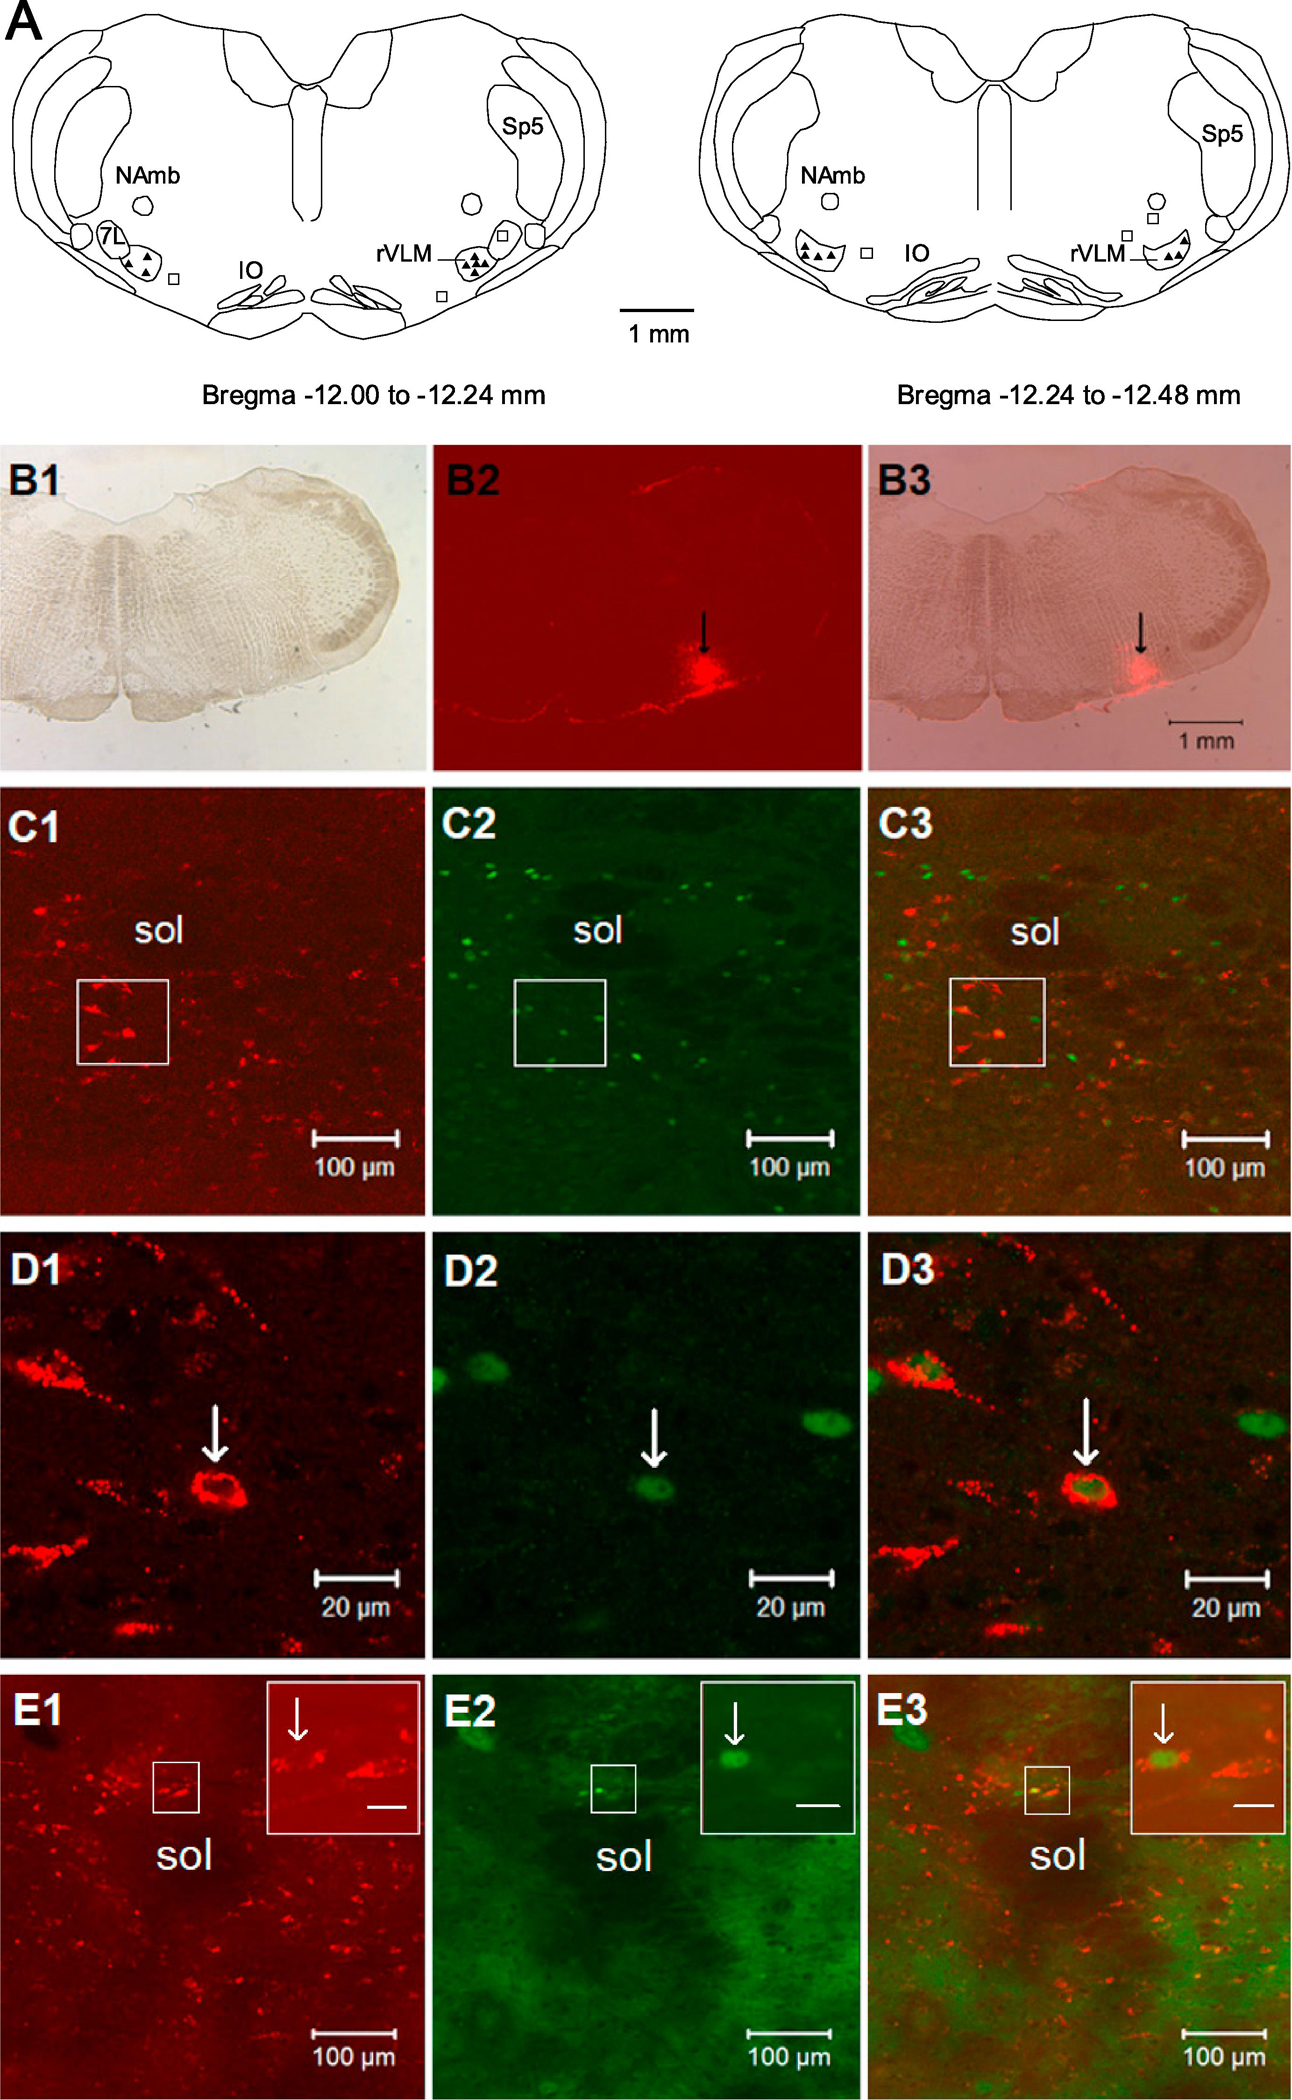
Microscopic images demonstrating NTS neurons stained with the retrograde microsphere tracer originated from rVLM, c-Fos, and both labels. Panel A: composite maps of rat medulla oblongata displaying histologically verified sites of microinjections of the retrograde microsphere tracer (tracer) into the rVLM of rats. Symbols (▲) and □ indicate injection sites inside and outside the rVLM, respectively. All the injections were unilateral (side chosen randomly). Two sections represent levels from Bregma −12.00 to −12.24 mm and −12.24 to −12.48 mm (Paxinos and Watson’s rat brain atlas (Paxinos and Watson, 2009)). 7L, facial nucleus; NAmb, nucleus ambiguous; IO, inferior olive; rVLM, rostral ventrolateral medulla; Sp5, spinal trigeminal nucleus. Panels B1–3: microphotographs show an original microinjection site of the tracer in the rVLM (Bregma −12.12 mm). B1: the medulla section under bright field. B2: fluorescent image showing the microinjection site of the tracer in the medulla section. B3: merged image from B1 and B2. Arrows in B2 and B3 indicate the injection site located in the rVLM. Scale bar in B3 represents 1 mm and is applied to B1–3. Panels C1–3: low-power confocal microscopic images show NTS neurons (Bregma −13.80 mm) that are stained with the tracer originated from the rVLM as shown in Panels B1–3, c-Fos, and the tracer + c-Fos in one rat treated with electroacupuncture. C3 is a merged image from C1 and C2. Panels D1–3: magnified regions those are shown within boxes in C1–3 correspondingly. Arrows in D1–3 indicate a neuron labeled with the tracer (red), Fos-positive nucleus (green) and c-Fos + the tracer, respectively. Panels E1–3: low-power confocal microscopic images show NTS neurons (Bregma −13.80 mm) stained with the tracer originated from the rVLM, c-Fos, and the tracer + c-Fos in one rat treated with sham electroacupuncture. E3 is a merged image from E1 and E2. Insets in the upper right corner in E1–3 demonstrate magnified regions those are shown within boxes in E1–3 correspondingly. Arrows in the insets indicate a neuron labeled with the tracer (red), Fos-positive nucleus (green) and c-Fos + the tracer, respectively. Scale bars in C1–3 and E1–3, D1–3, and the insets in E1–3 represent 100, 20, and 10 μm, respectively. Sol, solitary tract; NTS, nucleus tractus solitarii.
