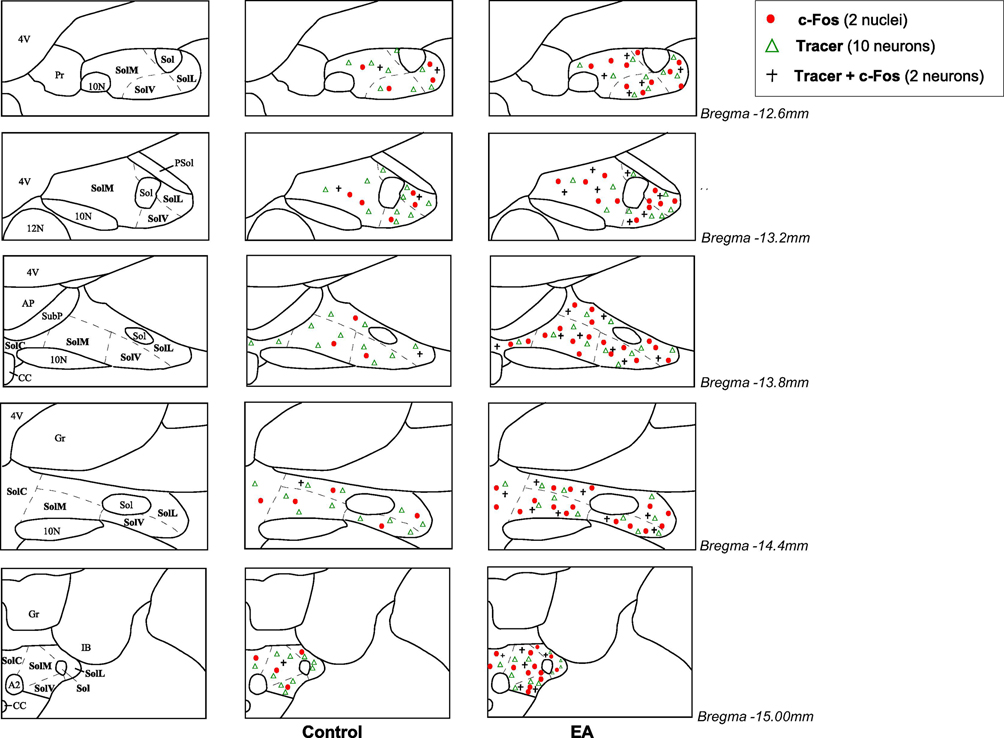
Figure 2.
Distribution of c-Fos immunoreactivity and/or cells labeled with retrograde microsphere tracer (tracer) in the nucleus tractus solitarii (NTS) following electroacupuncture (EA) or sham-EA. Five ipsilateral coronal sections of the NTS following injection of the tracer in the rostral ventrolateral medulla (Paxinos and Watson’s atlas (Paxinos and Watson, 2009)) selected from one animal in each experimental group. Each symbol represents labeled cells: Δ, ten cells labeled with the tracer; ●, two c-Fos positive nuclei; +, two neurons co-labeled with c-Fos + tracer.

