
Figure 3. Post Hoc Comparisons of Average Connectivity by Group: Frontoparietal Control Networks A and B.
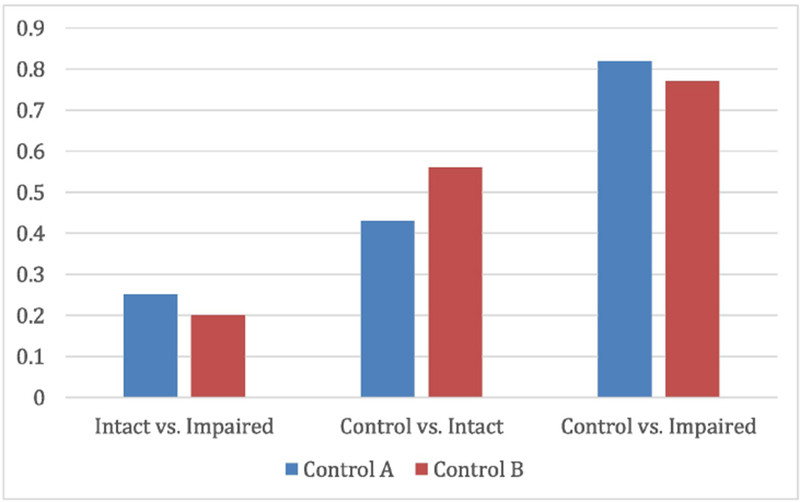
Effects sizes (Cohen’s d) of the pairwise contrasts in subnetwork connectivity in FPN subnetwork A (“Control A”) and FPN subnetwork B (“Control B”). Mean within-subnetwork connectivity was calculated for each group; pairwise effect sizes (Intact vs. Impaired; Control vs. Intact; Control vs. Impaired) were then calculated to reflect the magnitude of within network connectivity in the less impaired group relative to the more impaired group, or the patient groups compared to the control group.