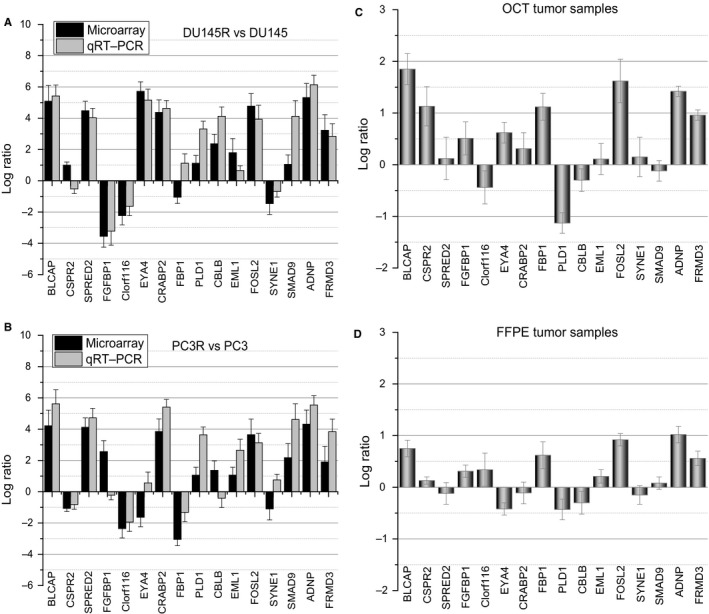
Figure 7.

qRT‐PCR analysis of differentially expressed genes identified in the microarray. A, DU145R vs DU145, B, PC3R vs PC3, C, optimal cutting temperature (OCT) and D, formalin‐fixed, paraffin‐embedded (FFPE) tumour samples from patients with metastatic castration‐resistant prostate cancer. Expression data are represented by a log ratio calculated by comparing ΔCq from the xenograft with ΔCq from the controls. ΔCq was calculated as the difference between Cq of the targeted genes and Cq of the endogenous control gene ACTB
