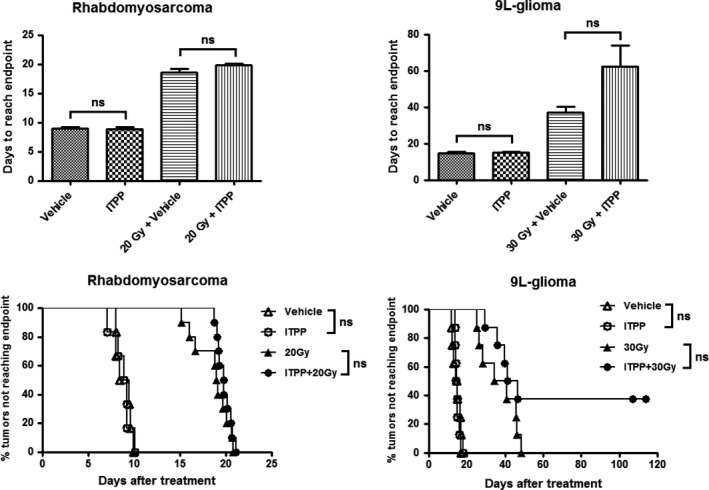
Figure 5.

Effect of ITPP treatment (2 g/kg once daily for 2 days) on tumour growth of rhabdomyosarcoma and 9L‐glioma. Top panel: Bar graphs showing the time for tumours to reach the end‐point. Bottom panel: Kaplan‐Meier curves showing the percentage of tumours that did not reach the end‐point. For the cured tumours, the ending day of experiment was taken as the value of tumour growth time. “ns” = not significant. (n = 6‐10/group)
