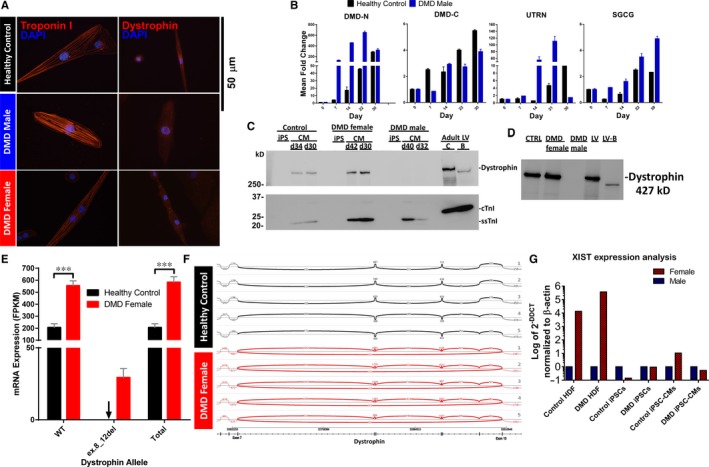
Figure 1.

Induction of muscle specific dystrophin and dystrophin‐glycoprotein complex (DGC) expression during iPSC‐CM differentiation. (A) Immunofluorescence staining of iPSC‐CMs >30 d shows presence of sarcomere localized Troponin I and dystrophin expression (C‐terminal antibody). Dystrophin is reduced in all DMD iPSC‐CMs and some DMD female iPSC‐CMs. (B) mRNA expression of muscle specific 427 kD dystrophin (DMD‐N) and DGC components in DMD male and control iPSC‐CMS; n = 2‐5 independent differentiations for each time point. (C) Western blotting of full‐length dystrophin, slow skeletal troponin I (ssTnI, 22 kD), and cardiac troponin I (cTnI, 26 kD) in control and DMD iPSC‐CMs, and adult left ventricle (LV) tissue lysates. iPSC‐CMs were collected at >30 d (d). Mean dystrophin/TnI ratio by densitometry was 6.3, 1.1 and <0.02 in control, DMD female and male preparations, respectively. LV adult tissue lysates were generated from adult control (C) and Becker muscular dystrophy (BMD) patients with an in‐frame dystrophin deletion leading to truncated dystrophin (B). (D) Wheat germ agglutinin (WGA) purification enriches the glycosylated proteins of the dystrophin‐glycoprotein complex and dystrophin in control (CTRL) iPSC‐CMs, DMD female iPSC‐CMs but is absent in DMD male iPSC‐CM. LV tissue samples from adult control (LV) and BMD (LV‐B) patients show enrichment of dystrophin as expected. Mixed expression of dystrophin (WT and mutated (ex.8_12del) alleles in the DMD female iPSC‐CM population. (E) NGS analysis of the dystrophin alleles mRNA expression in DMD female and control iPSC‐CMs. Fragments per kilobase of exon per million reads mapped (FPKM) values were normalized by library size and corrected by enrichment factor. Black arrow indicates zero expression of the mutated allele in control iPSC‐CMs samples. Control n = 5; DMD female, n = 5. Two‐way ANOVA followed by Holm‐Sidak post‐hoc analysis. ***P < 0.001. (F) Sashimi plot of the WT allele RNA in control iPSC‐CMs (top) and both WT and mutated alleles RNA in DMD female iPSC‐CMs (bottom). (G) Expression of XIST RNA in female compared to male human fibroblasts (HF), iPSC and iPSC‐CM as determined by qRT‐PCR. Expression of XIST was normalized to ß‐actin and relative expression levels are shown as 2−△△CT compared to the respective male control
