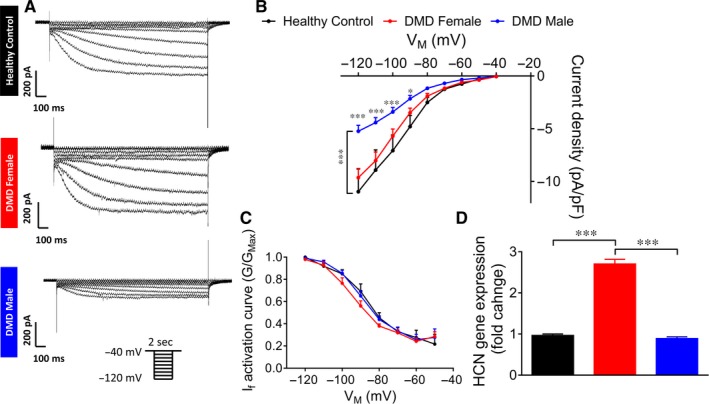
Figure 4.

I f in control and DMD iPSC‐CMs. (A) Representative recordings of I f in control and DMD iPSC‐CMs. (B) I f Current‐Voltage (I‐V) curve in control and DMD iPSC‐CMs. (C) I f activation curve. Control n = 8; DMD female, n = 10; DMD male, n = 12. Two‐way ANOVA followed by Holm‐Sidak post‐hoc analysis. (D) Gene expression of HCN (isoforms HCN2 and HCN4) in control and DMD iPSC‐CMs. Duplicates/triplicates of independent differentiations were used for each clone: control, DMD female and DMD male; n = 3 for each experimental condition. One‐way ANOVA followed by Holm‐Sidak post‐hoc analysis. *P < 0.05, ***P < 0.001
