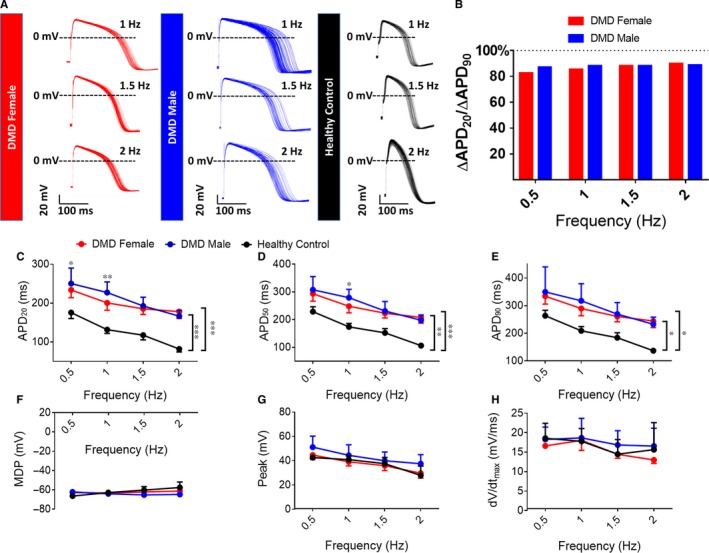
Figure 5.

Action potential parameters of paced control and DMD iPSC‐CMs. (A) Representative paced action potentials displaying prolonged APDs in DMD iPSC‐CMs compared to control. (B) The ratio between the difference in APD20 and the difference in APD90 of DMD and control iPSC‐CMs demonstrating the main prolongation during early repolarization. Control n = 8; DMD female, n = 8; DMD male, n = 9. Action potential amplitude. (C‐H) Action potential parameters of iPSC‐CMs under different pacing frequencies. (C‐E) Action potential duration at 20/50/90% of repolarization (APD20/50/90); (F) Maximal diastolic potential (MDP); (G) Action potential peak; (H) Maximal rate of phase 0 depolarization (dV/dtmax). Two‐way ANOVA followed 5 by Holm‐Sidak post‐hoc analysis. *P < 0.05, **P < 0.01, ***P < 0.001
