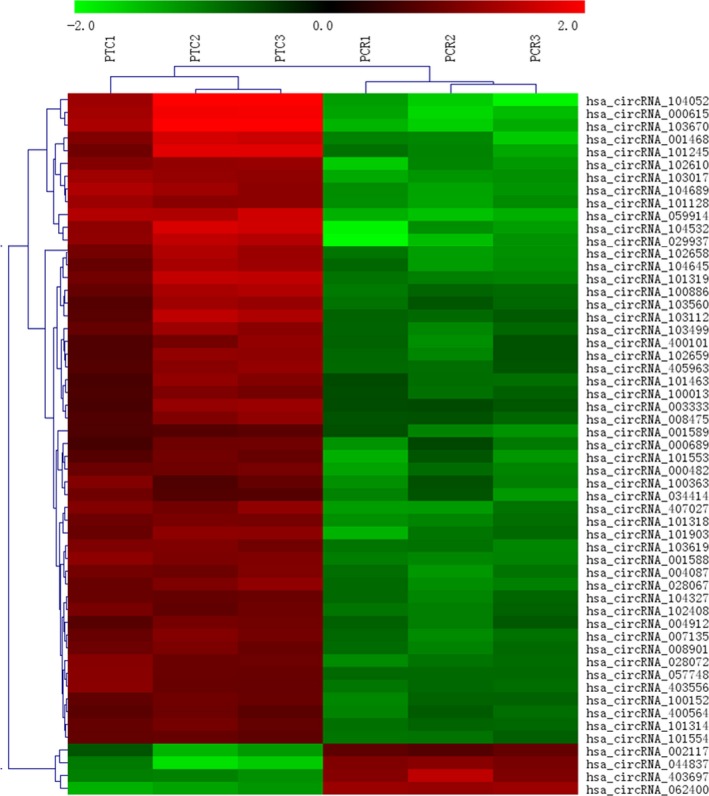
Figure 1.

Hierarchical cluster analysis of circRNA expression in PBMCs from active TB group compared with control group. Expression of the dysregulated circRNAs with FC > 3 and FDR adjusted P value <0.05 was depicted in the hierarchical clustering. The red and green represented an increased and a decreased expression of circRNAs, respectively. Cluster analysis indicated that circRNAs expression pattern was altered in PBMCs from active TB patients. PBMC: peripheral blood mononuclear cells; FC: fold change; FDR: false discovery rate; PTC: active TB group; PCR: control group
