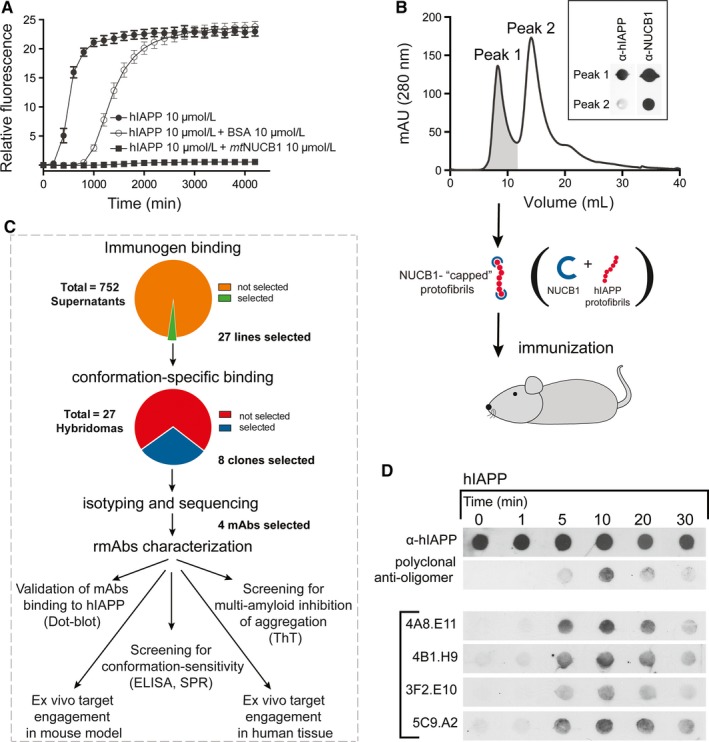
Figure 1.

Production and validation of anti‐hIAPP monoclonal antibodies. A, The NUCB1‐mediated inhibition of hIAPP aggregation was monitored by the ThT assay. Time‐course graph shows the aggregation of hIAPP (10 µmol/L) alone and in the presence of equimolar concentration of BSA or NUCB1, incubated with 10 µmol/L ThT at 25°C. B, Size exclusion chromatography elution curve identifies two fractions of NUCB1‐hIAPP complexes of different size obtained by a mixture of hIAPP (33 µmol/L) and mtNUCB1 (10 µmol/L) incubated at 37°C for 3 h while stirred. The inset shows the reactivity of Peak 1 and Peak 2 to α‐hIAPP and α‐NUCB1 antibodies tested by dot blot. C, Schematic of the immunization strategy showing that Peak 1 composed of NUCB1‐capped hIAPP protofibrils was used to immunize mice. Out of 752 cell lines, 27 were selected based on their positive binding to NUCB1‐hIAPP complex and negative binding to NUCB1. Eight of these were isotyped and sequenced and 4 lines were selected for antibody purification and further studies. D, The monoclonal IgGs obtained from the selected hybridomas were validated by testing their binding to hIAPP by dot blot. The four mAbs (4A8.E11, 4B1.H9, 3F2.E10 and 5C9.A2), as well as the α‐hIAPP and the polyclonal anti‐oligomer A11 antibodies were tested on hIAPP (10 µmol/L) incubated for different time points (0, 1, 5, 10, 20 or 30 min)
