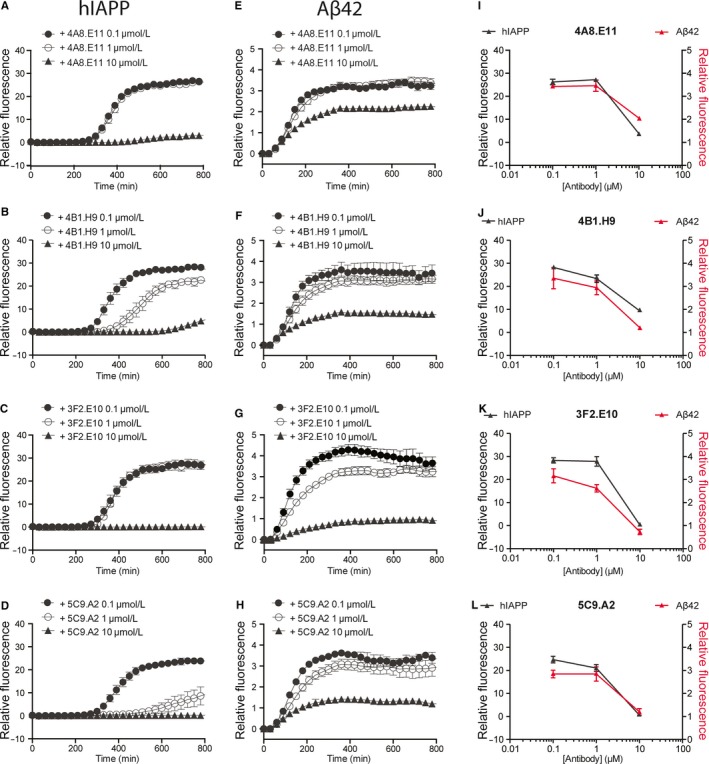
Figure 3.

mAbs inhibit hIAPP and Aβ42 aggregation. The mAbs‐mediated inhibition of hIAPP and Aβ42 aggregation was monitored by the ThT assay. Time course graphs show the aggregation of A‐D) hIAPP (10 µmol/L) and E‐H) Aβ42 (10 µmol/L) incubated with 10 µmol/L ThT at 25 and 37°C, respectively, alone or together with different concentrations of A, E) 4A8.E11; B, F) 4B1.H9; C, G) 3F2.E10 and D, H) 5C9.A2. I‐L) Data shown in A‐H are plotted together for direct comparison of the inhibition exerted by I) 4A8.E11; J) 4B1.H9; K) 3F2.E10 and L) 5C9.A2 on the aggregation of hIAPP (10 µmol/L, black) and Aβ42 (10 µmol/L, red). Data are expressed as relative fluorescence and presented as mean ± SEM
