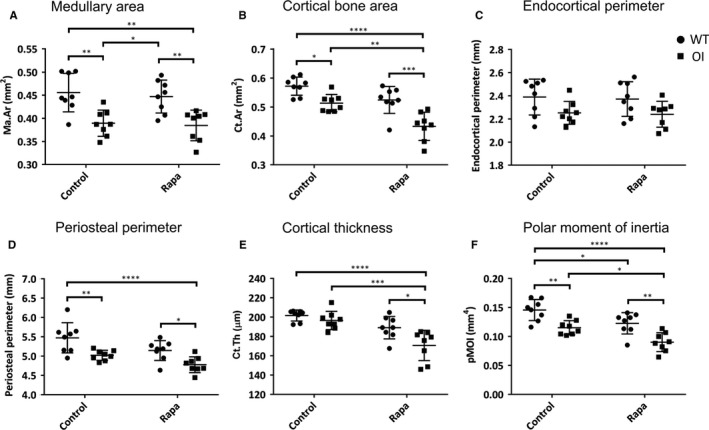
Figure 3.

Micro‐CT of tibial cortical bone. (A) Ma.Ar = medullary area (mm2); (B) Ct.Ar = cortical bone area (mm2); (C) Endocortical perimeter (mm); (D) Periosteal perimeter (mm); (E) Cortical thickness (μm); (F) pMOI = polar moment of inertia (mm4). Control and rapamycin (Rapa) treatment groups are indicated, ● WT, ■ OI. All values are the mean ± SD; Two‐way ANOVA with Tukey's post hoc test, *P < 0.05, **P < 0.01, ***P < 0.001, ****P < 0.0001
