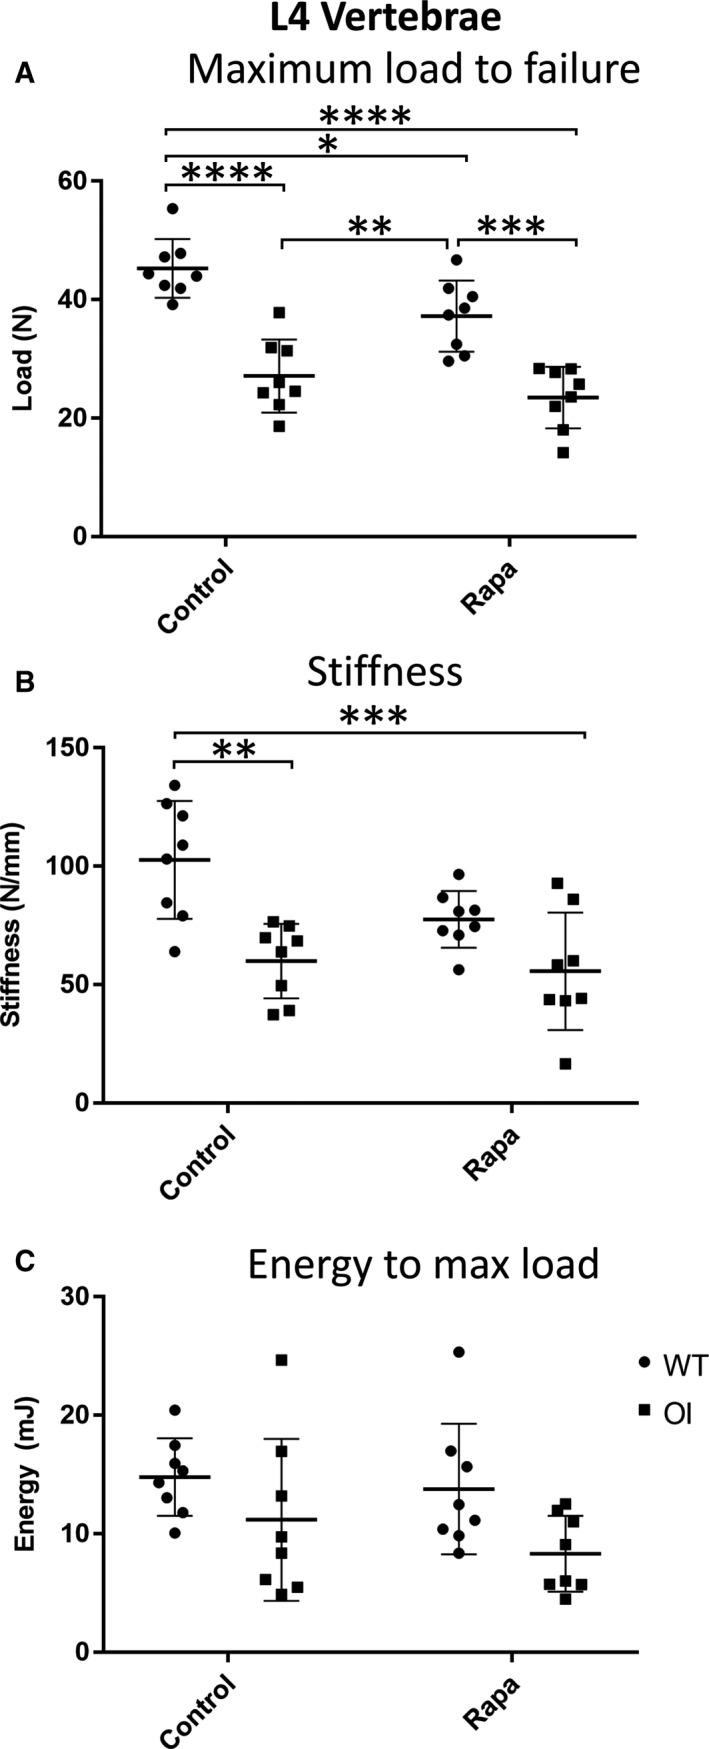
Figure 5.

Compression testing of L4 vertebrae. (A) Maximum load to failure (N); (B) Stiffness (N/mm); (C) Energy to maximum load (mJ). Control and rapamycin (Rapa) treatment groups are indicated, ● WT, ■ OI. Data were analysed using a two‐way ANOVA with Tukey's post hoc test. *P < 0.05, **P < 0.01, ***P < 0.001, ****P < 0.0001
