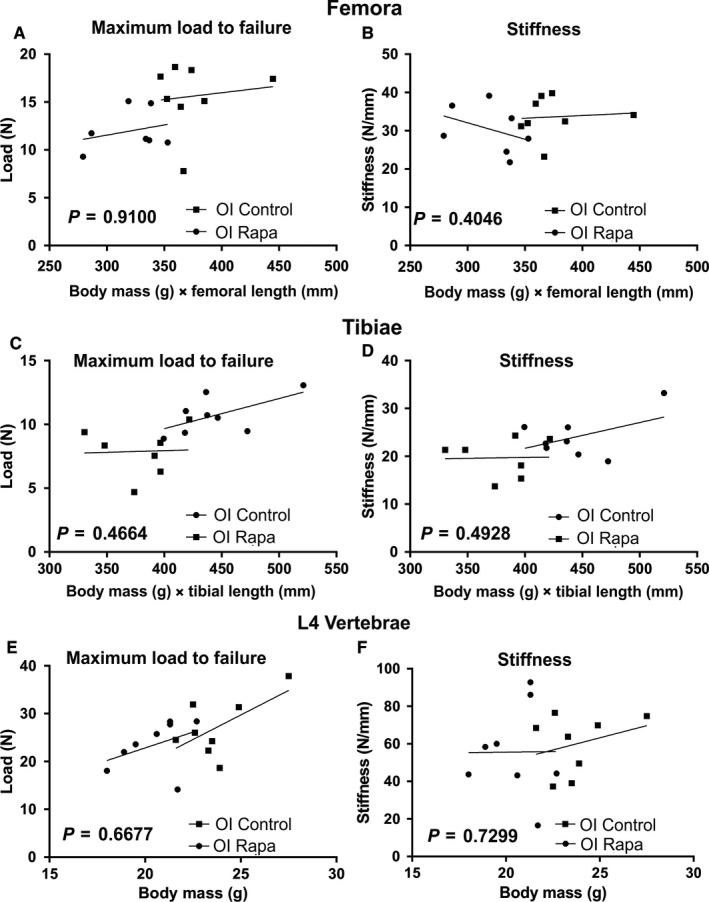
Figure 6.

OI mechanical data corrected for body size and bone length. To correct for the reduced body weight and bone length of rapamycin‐treated OI mice the data were plotted against individual mouse weight × bone length previously described.28 For each plot, the significance (P‐value) of the difference between the slopes of untreated OI (■, OI Control) and rapamycin‐treated OI (●, OI Rapa) bones are indicated (ANCOVA). The r 2 value and P‐value for each plot is given below to describe if the slope is significantly non‐zero. (A) Femora—Maximum load to failure (N); OI Control r 2 = 0.01558, P = 0.7684; OI Rapa r 2 = 0.07437, P = 0.5540. (B) Femora—Stiffness (N/mm); OI Control r 2 = 0.00668, P = 0.8475; OI Rapa r 2 = 0.1436, P = 0.4019. (C) Tibiae—Maximum load to failure (N); OI Control r 2 = 0.3598, P = 0.1160; OI Rapa r 2 = 0.00185, P = 0.9271. (D) Tibiae—Stiffness (N/mm): OI Control r 2 = 0.2116, P = 0.2514; OI Rapa r 2 = 0.00069, P = 0.9554. Compression testing of L4 vertebrae. (E) Maximum load to failure (N); OI Control r 2 = 0.365, P = 0.1127; OI Rapa r 2 = 0.1602, P = 0.3259. (F) Stiffness (N/mm); OI Control r 2 = 0.08933, P = 0.4721; OI Rapa r 2 = 0.00005, P = 0.9870
