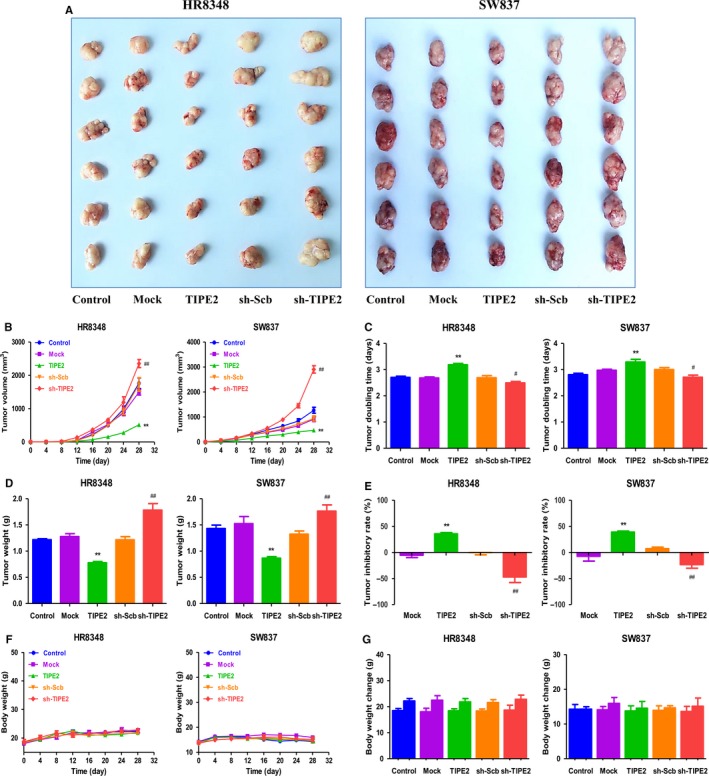
Figure 6.

Effects of TIPE2 on the growth of HR8348 and SW837 xenograft tumours in nude mice. A, Representative xenografts dissected from different groups of nude mice were shown. B, C, The tumour volume of each group was measured every day and the TVDT was calculated by the formula shown above. D, E, The tumours were weighed and the inhibition rates of tumour growth were calculated by the formula shown above. F, G, The bodyweight change curve of each group during the experiment and the bodyweight of each group on the first day (day 0) and the last day (day 28). Values are presented as mean ± SEM (n = 6); *P < 0.05, **P < 0.01 compared with the Mock group; # P < 0.05, ## P < 0.01 compared with the sh‐Scb group.
