
Figure 7.
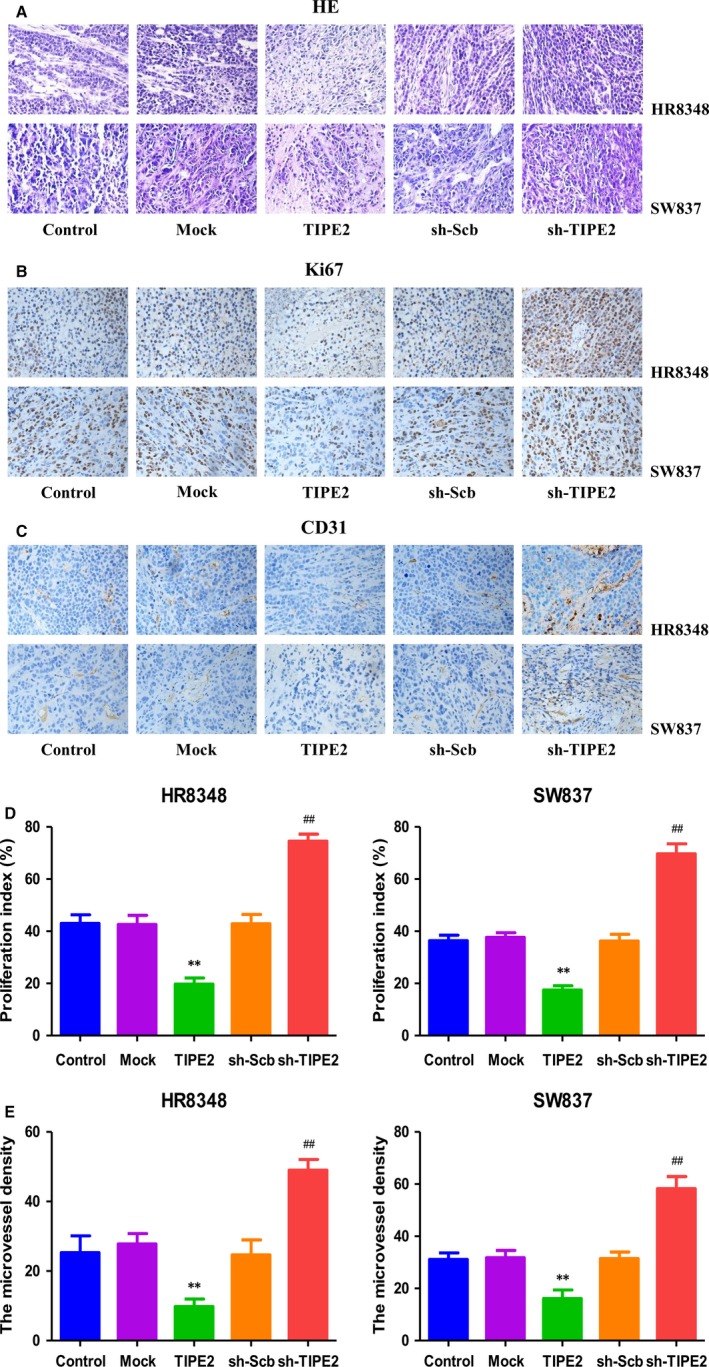
Effects of TIPE2 on the PI and MVD of human rectal adenocarcinoma xenografts. A‐C, Representive photographs of HE, Ki67, and CD31 staining in HR8348 and SW837 xenograft tumours; original magnification 400×. D, E, The PI and MVD were calculated by the formula shown above. Values are presented as mean ± SEM (n = 6); *P < 0.05, **P < 0.01 compared with the Mock group; # P < 0.05, ## P < 0.01 compared with the sh‐Scb group.