
Figure 2.
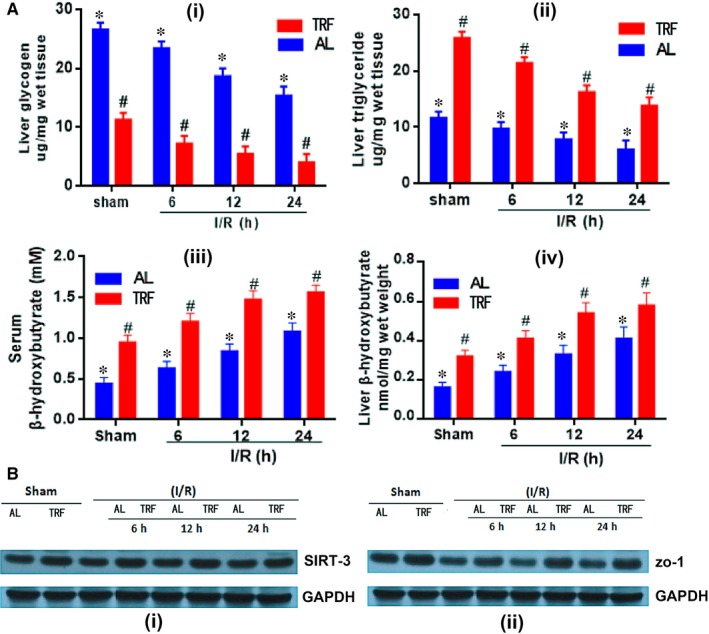
Alterations of liver energy source. (A) Concentrations of liver glycogen, liver triglyceride, serum β‐hydroxybutyrate and liver β‐hydroxybutyrate were shown by different timing and feeding model respectively, *P < 0.05 indicated significant difference between ischaemia reperfusion group and sham group. #P < 0.05 was tagged if statistical significance was detected between AL and TRF groups, n = 6. (B) Western blot was applied to show the increase of SIRT‐3 and zo‐1 proteins caused by TRF dietary pattern. GAPDH was used as the internal reference. AL: ad libitum; TRF: Time‐restricted feeding; zo‐1: zonula occludens‐1; GAPDH: glyceraldehyde 3‐phosphate dehydrogenase