
Figure 4.
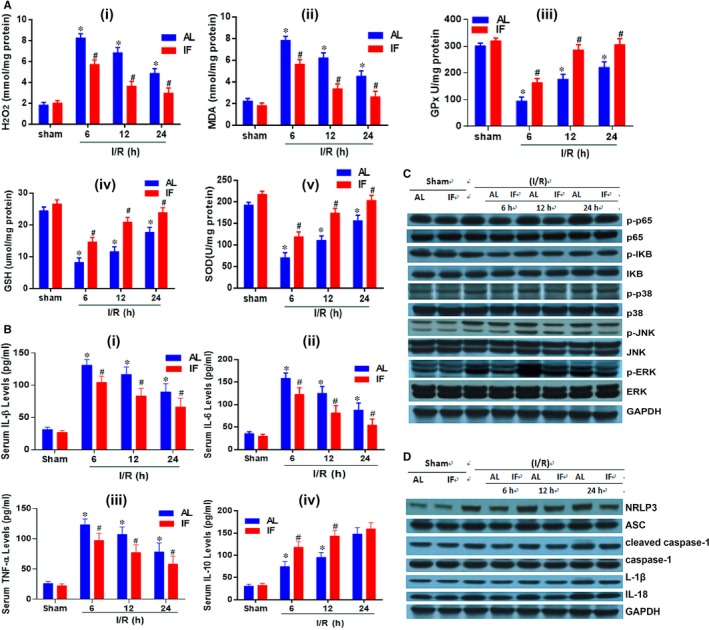
Biomarkers of oxidative stress and inflammatory reactions. (A) The levels of oxidative stress biomarkers in the liver measured at 6, 12, 24 h post‐operation, and comparison with the sham group. Biomarkers included: H2O2, MDA, GPx, GSH, and SOD. (B) Serum concentration of inflammatory factors including TNF‐α, IL‐1β, IL‐6, and IL‐10. *P < 0.05 indicated significant difference between ischaemia reperfusion group and sham group. #P < 0.05 was tagged if statistical significance was detected between AL and TRF groups, n = 6. (C) Western blot showing titre of proteins involved in ischaemia reperfusion injury pathways. (D) Demonstration of inflammatory complex and proteins via Western blot technology. AL: ad libitum; TRF: time‐restricted feeding; MDA: malondialdehyde; GPx: glutathione peroxidase; GSH: glutathione; SOD: superoxide dismutase; TNF‐α: tumour necrosis factor‐ α, IL: interleukin; p‐p65: phospho‐P65‐nuclear factor (NF)‐κB; p‐IKB: phospho‐IκB; p‐p38: phospho‐p38; GAPDH: glyceraldehyde 3‐phosphate dehydrogenase; NLRP3: NACHT, LRR and PYD domains‐containing protein 3; ASC: apoptosis‐associated speck‐like protein containing a caspase recruitment domain