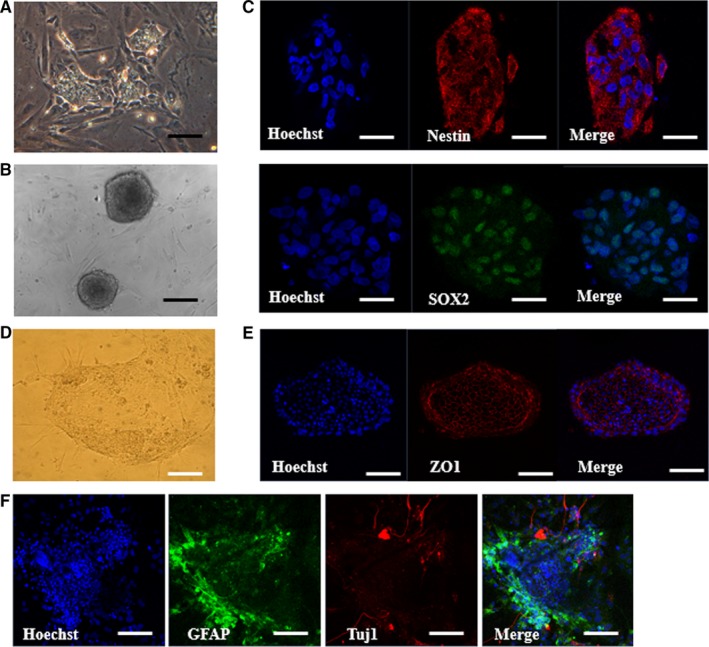
Figure 5.

Formation of neurospheres and further differentiation from porcine iPSC‐derived NPCs. A, Representative images of neural progenitor cells (NPCs) (A) and neurosphere (B). Scale bars = 50 µm. C, Immunofluorescence labelling of the neural progenitor cell markers (NESTIN and SOX2). The experiment was replicated three times. D, Representative images of neurite outgrowth derived from clump of colonies plated on Matrigel‐coated dishes at day 2 after plating. E, Immunofluorescence labelling of the tight junction (ZO1) of the cells consist of plated clump. F, Representative immunofluorescence images that show the increased expression of the astrocyte marker GFAP in some of the cells and the outgrowths of Tuj1‐positive cells derived from the clumps. Scale bars = 50 µm. The experiment was replicated three times
