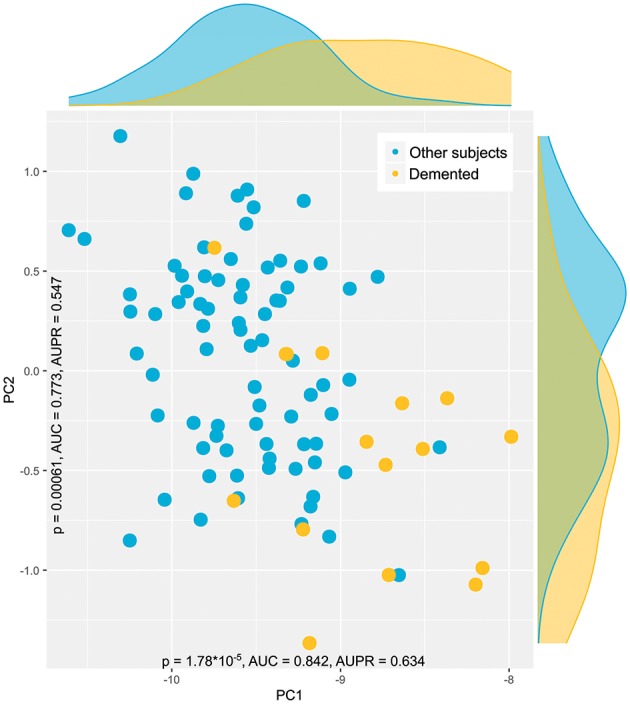
Figure 4.

Data structure found in the input space of d = 35 lipid mediator plasma concentration acquired from patients with dementia (yellow dots) or from patients with either bipolar disorder, depression, ADHD, or enrolled as healthy controls (blue dots). The data structure has been obtained by means of principal component analysis on the log-transformed data as suggested by the results of the PC-corr analysis (39). The PCA plot associated to this analysis shows the sample separation in the first and second component (PC1 vs. PC2) as explaining most of the variance in the data. In addition, the group-wise marginal distributions of the data are shown. The figure has been created using the R software package [version 3.4.4 for Linux; http://CRAN.R-project.org/; (13)] and the library “ggplot2” [https://cran.r-project.org/package=ggplot2; (65)].
