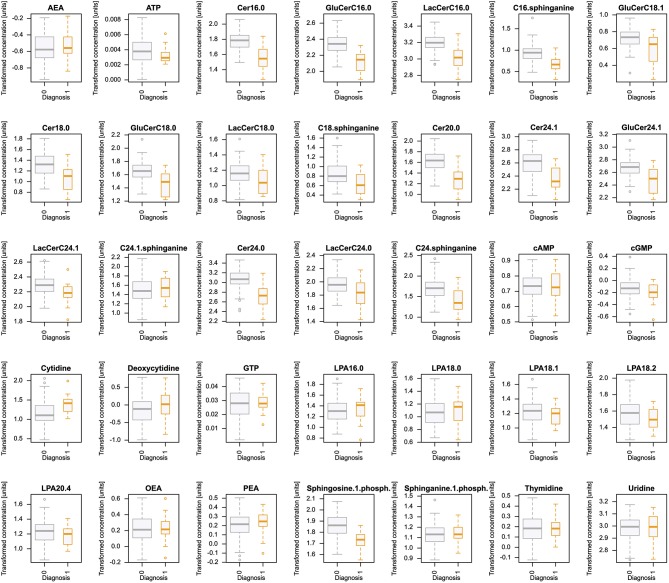
Figure 5.
Plasma concentrations of d = 35 lipid mediators (transformed and age corrected data) acquired from patients with dementia (yellow) or from patients with either bipolar disorder, depression ADHD or enrolled as healthy controls (gray). The data are shown in alphabetical order of lipid mediator names and for each mediator, separately for group membership to either or not the diagnosis of dementia (dementia = 1, others = 0). The widths of the boxes are proportional to the respective numbers of subjects per group. The quartiles and medians (solid horizontal line within the box) are used to construct a “box and whisker” plot. Single data are shown as dots. The whiskers add 1.5 times the interquartile range (IQR) to the 75th percentile or subtract 1.5 times the IQR from the 25th percentile and are expected to include 99.3% of the data if normally distributed. The figure has been created using the R software package [version 3.4.4 for Linux; http://CRAN.R-project.org/; (13)].

