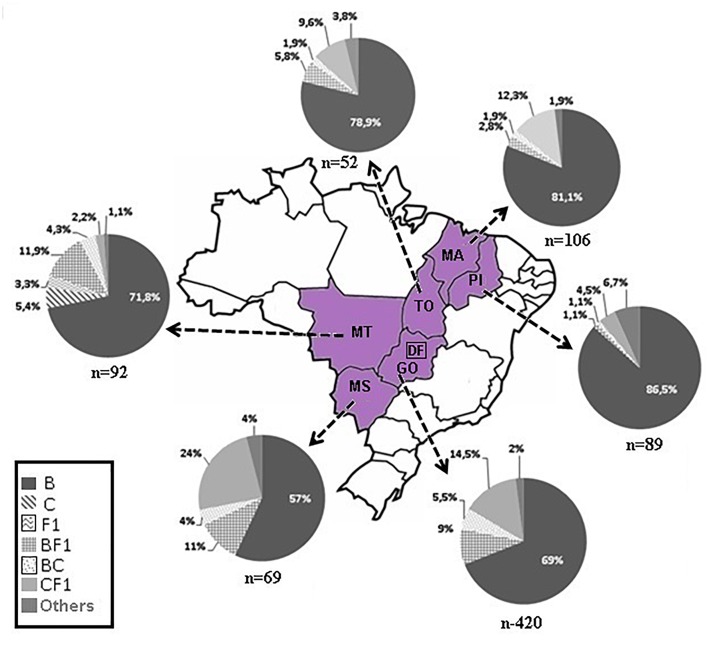
FIGURE 1.
Map of Brazil highlighting our study area. The pie-charts depict the frequency of HIV-1 subtypes of 828 patients living in six states located in three geographic regions, Central Western: Goiás/GO, Mato Grosso/MT, Mato Grosso do Sul/MS; Northern: Tocantins/TO; and Northeastern: Maranhão/MA, Piauí/PI. The number of pol sequences analyzed is depicted below each pie chart.

